Corporate earnings and guidance
Published: Oct 17, 2022
Updated: Nov 27, 2023
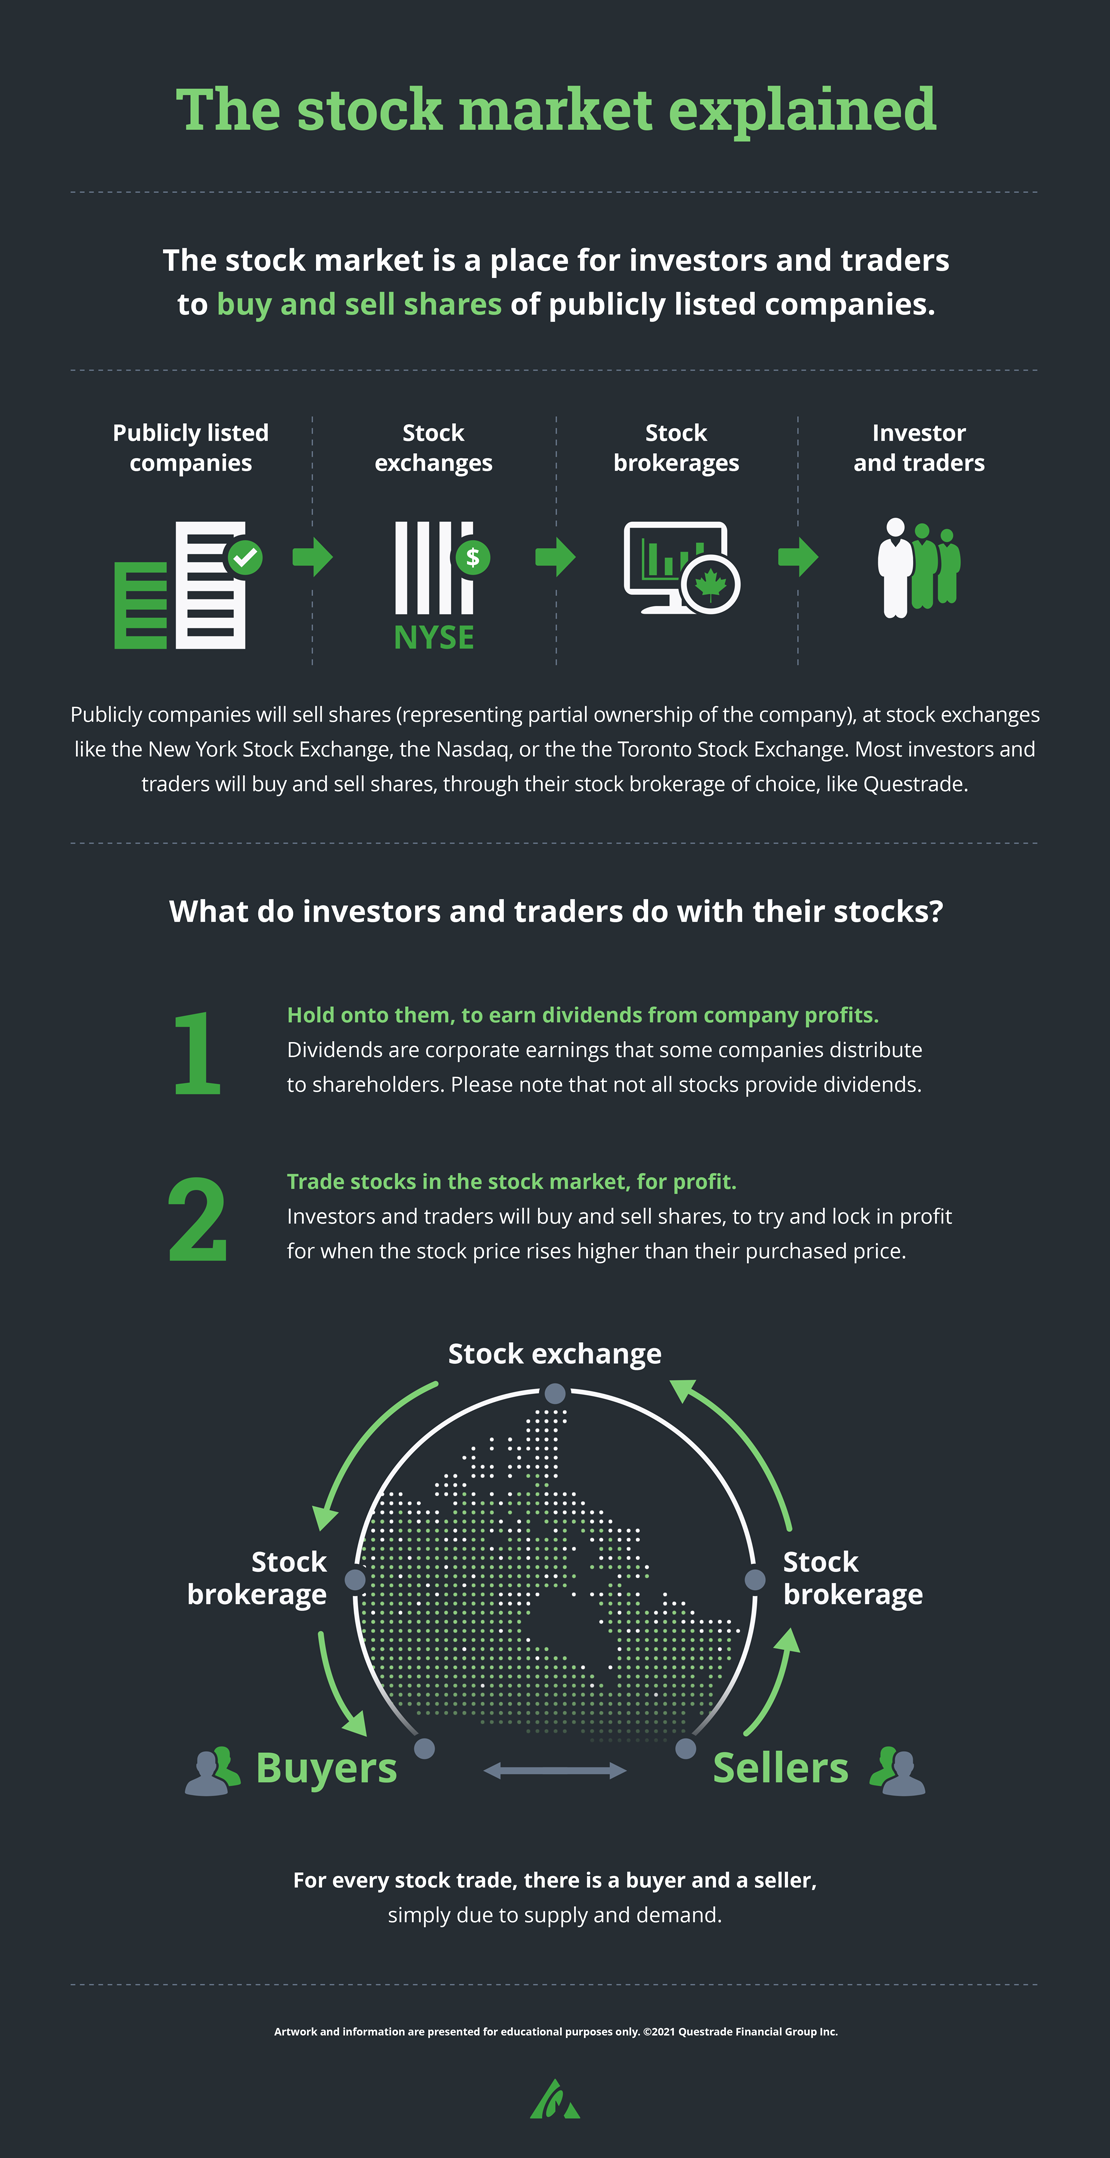
Publicly-traded corporations that trade on major exchanges are required to provide financial statements on a regular basis. When a corporation provides these statements, they are often referred to as an Earnings Report.Earnings reports contain 3 key pieces of information:
Balance sheet
Income statement
Cash flow statement
Publicly-traded corporations that trade on major exchanges are required to provide financial statements on a regular basis. When a corporation provides these statements, they are often referred to as an Earnings Report.
Earnings reports contain 3 key pieces of information:
Balance sheet
Income statement
Cash flow statement
When investors view these reports, they’re able to see an overview of sales, expenses, net income and importantly the Earnings per share (EPS). Using this information about the EPS, you’re also able to calculate the Price-to-earnings ratio (P/E ratio), which is sometimes seen as an important indicator of a company’s profitability. We’ll dive deeper into these topics below.
What is Corporate Guidance?
Guidance is an optional, informal report that a publicly-traded company issues to its shareholders before the earnings report and financial statements are released. In these reports, corporations outline the earnings they expect to achieve in the upcoming quarter (3 months) or year.
Companies will often share their guidance through their investor relations websites and other media like quarterly conference calls. While publicly traded companies are not obligated to release earnings guidance reports, the vast majority do.
Tip: Guidance is also referred to as “forward-earnings guidance” or “forward-looking statements/reports”.
These reports, prepared by company executives, often include commentary about revenue estimates, expenses, and earnings within the context of the current industry and economic environment.
Although many investors use earnings guidance to evaluate a company’s performance and earnings potential, it’s important to note that these reports are ultimately subjective. Companies may fail to meet expectations, or guidance can be presented in a very biased way.
Where can I see new and historical guidance?
Using Questrade Edge Web or Desktop, log in, and head to the Events calendar.
Navigate to the Guidance tab, and you’ll see the most recently released corporate guidance reports, or search by ticker or date. Learn more in this Events Calendar article.
Looking for more information? Check the company’s investor relations website, or listen in to a conference call.
What is Earnings per share (EPS)?
Earnings per share (EPS) is a company's net profit divided by the number of common shares (stocks) it has outstanding (sometimes called the “float”). EPS indicates how much money a company makes for each share of its stock and is a widely used metric for estimating corporate value.
A higher EPS usually indicates greater value because investors will pay more for a company's shares if they think the company has higher profits relative to its share price.
The formula for EPS is simple, it’s the Net income divided by the number of shares.
You can always see both the EPS and the number of common shares for a company in the level 1 quote window.
Remember: The number of common shares multiplied by the current share price is also known as the market capitalization of the company. In popular media, this is commonly referred to as the value, or worth of the company.
Apart from changes to a company’s profitability, the 2 biggest changes in EPS can happen in the following 2 scenarios:
A company decides to issue new shares if they need to raise more money for operations or expansion, which will decrease the EPS even if profitability stays the same. This is often referred to as “dilution”, and existing shareholders will technically have less equity in the company.
Some companies also participate in share buybacks where the issuer decides to buy back its own shares from the market. This decreases the overall amount outstanding, and can increase the EPS even if the profitability stays the same. These buybacks cause existing investors to have more equity in the company as the amount of publicly-traded shares decreases.
The growth of EPS over a period of time is also seen as what’s important and not necessarily the current number. A short-term spike in EPS followed by a decline may indicate negative future profitability. EPS will only increase over time if the percentage of profit growth is higher than the percentage increase in the number of shares outstanding.
You can view the estimated upcoming EPS, and actual EPS after an Earnings report using the Events calendar tool with Questrade Edge Web or Desktop.
What is a P/E ratio?
The price-to-earnings (P/E) ratio compares a company's share price to its earnings per share (EPS).
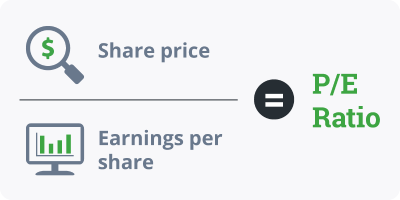
The formula is quite simple, it’s the current price per share, divided by the EPS.
Investors often use the P/E ratio to determine if they believe that the company is overvalued or undervalued.
A high P/E ratio (compared to industry averages) might potentially mean that a company's stock is overvalued, or that investors are expecting aggressive growth rates in the future. Lower P/E ratios may indicate a lack of profitability, but investors should understand the differences between companies in different sectors or industries. For example: Tech companies usually have much higher P/E ratios than consumer goods, or manufacturing.
Companies that have no earnings or that are losing money may not have a P/E ratio and will be shown as “N/A”, or may have a negative P/E.
You can view a company’s P/E ratio in the level 1 quote window using any Questrade trading platform. In this window you are shown the Trailing P/E which is the price/earnings ratio based on the last 4 quarters (year).
Important to know:
While P/E and EPS can provide a good picture of a company’s profitability, and overall financial health, they shouldn’t be the only things an investor relies on before making an informed decision to buy or sell.
While most companies follow Generally Accepted Accounting Practices (GAAP), or the International Financial Reporting Standards (IFRS), earnings reports may still be somewhat subjective. They are prepared by the issuer, and will try to show the company in the most favourable way possible.
Companies in different industries and sectors can have significantly different EPS, and P/E ratios. Certain “Mega-cap” companies may also be hard to analyze or compare since they operate across a variety of industries (I.e. tech, E-commerce, and shipping).
OTC and “penny” stocks that do not trade through designated exchanges often do not report financial statements, and therefore obtaining an accurate EPS or P/E can be difficult.
Most companies will release their Earnings reports before market hours, or after market hours. Learn more about pre and post market trading here.
While extremely rare, there have been instances of corporate accounting fraud with earnings reports or guidance. Historically popular examples include the bankrupt companies Enron (2001), or Lehman Brothers (2010). Investors should also obtain information from other reputable third parties including financial analysts or other media.
When a company releases guidance or earnings, financial analysts will often deep-dive into research and compile reports for reading by investors. You can use the Questrade Edge Web or Desktop platforms to view these analyst reports, learn more in this article.