Explore Questrade Edge Web
Published: Oct 17, 2022
Updated: May 05, 2025
Discover Edge Web, our powerful online trading platform.
Welcome to your Questrade account! Let us make it easy for you to navigate.
Below you will learn where to place a trade, view current positions, access watchlists, view current and previous orders, and more.
For more information about account information, deposits and withdrawals and other account-related information, visit Introduction to your account.
Index
Adding Questrade Edge Web and top navigation
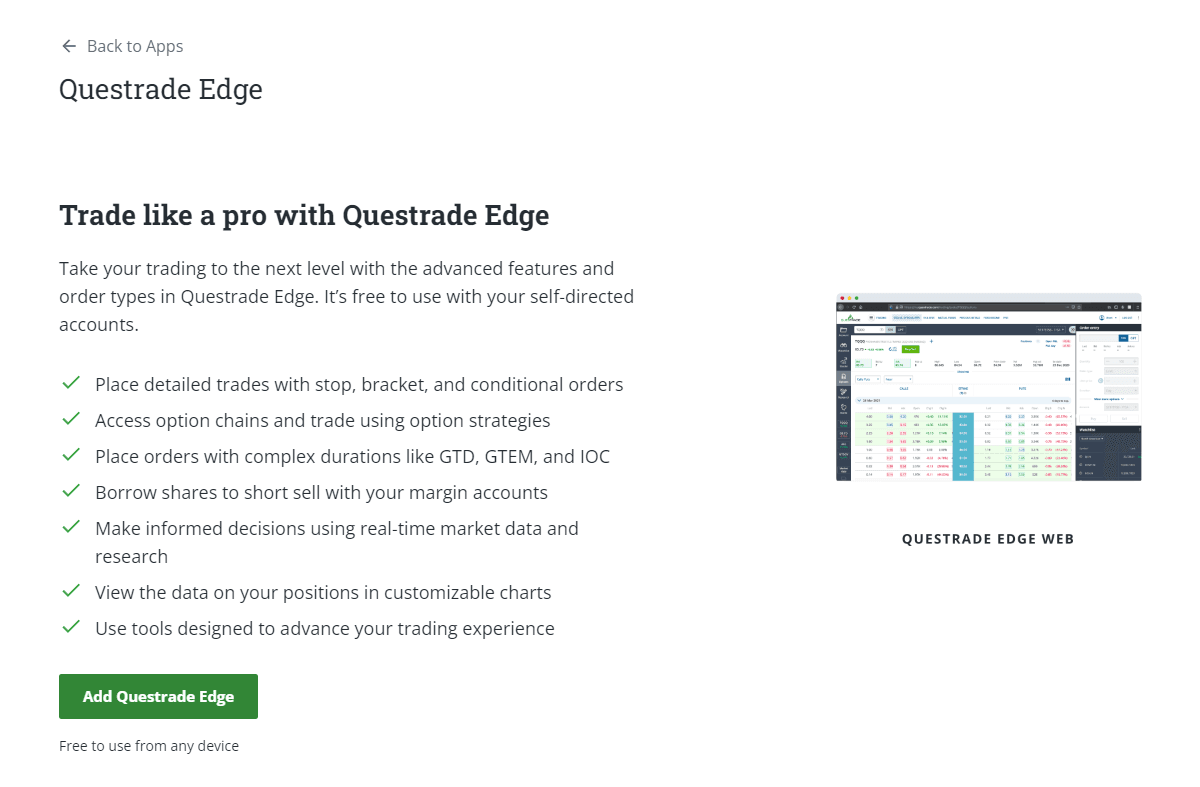
If you don’t have access to Questrade Edge Web, you can enable it by adding Questrade Edge to your platform.
Questrade Edge allows you to access Questrade Edge Web and Questrade Edge Desktop for more trading features like complex orders and durations.
Here’s how to add Questrade Edge Web:
On the top navigation bar, head over to the Apps page. From here, click on Edge.
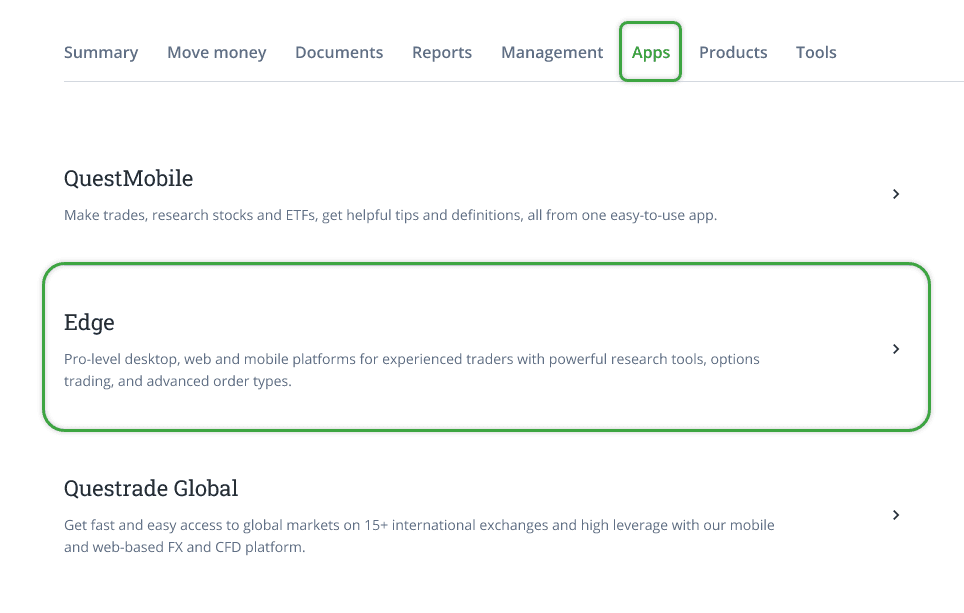
Once you’re inside the Edge page, click on the green Add Questrade Edge button.
Top navigation
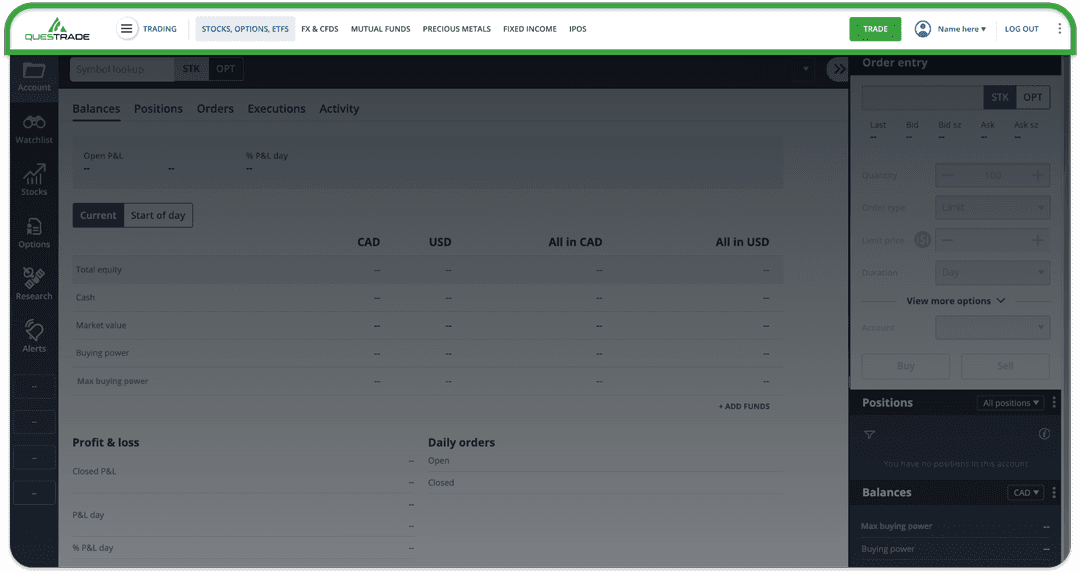
Visit each page to make trades and learn more about the various securities offered.
Stocks, Options, ETFs
Access the web-based trading platform where you can trade these investment products.
FX & CFDs
Learn more about FX & CFD trading, open a practice account, and access the platform.
Mutual Funds
Buy and sell mutual funds and access the Mutual fund centre (also accessible via Market Research).
Precious Metals
Learn about trading physical gold and silver, and metals storage and delivery.
Fixed Income
Access the bonds bulletin to compare bonds and GICs.
IPOs
Explore and buy into IPOs using the IPO centre.
Account menu
Compare Start of Day and Current account balances, including cash and market value.
View active positions in each account, add and remove columns to your preference.
View all submitted orders from up to the last 30 days.
View all executed orders from up to the last 30 days.
Activity
View account activity including login data.
Balances
Understanding your balances is key to managing a successful portfolio. The Balances tab allows you to conveniently track and manage your money.
On the ‘Balances’ tab within the trading platforms, you can view your cash in both CAD and USD, check the market value of your investments, and much more. Feel free to check out our balances video here.
To view your balances, log in to your account, and navigate to the web-trading platform. If you’re not on the trading platform after logging in, click “Accounts” from the top left navigation menu, then “Trading”.
By default, your homepage within the trading platform will be your balances tab on the account page.
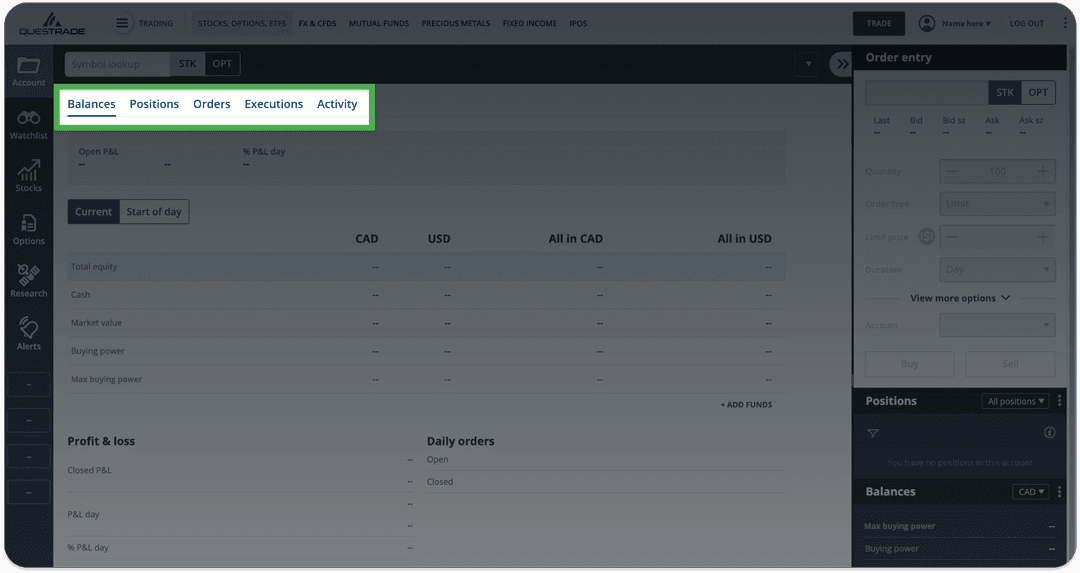
Here you can navigate through the different pages on the trading platform.
Within the “Account” page, there’s 5 tabs to choose from:
Balances
Positions
Orders
Executions
Activity
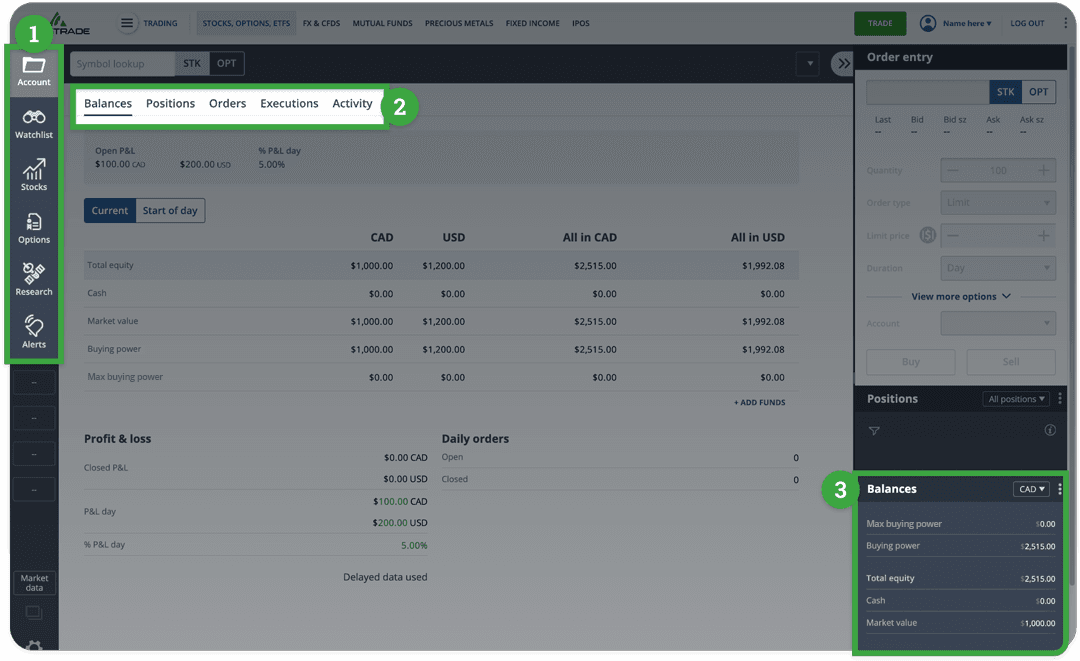
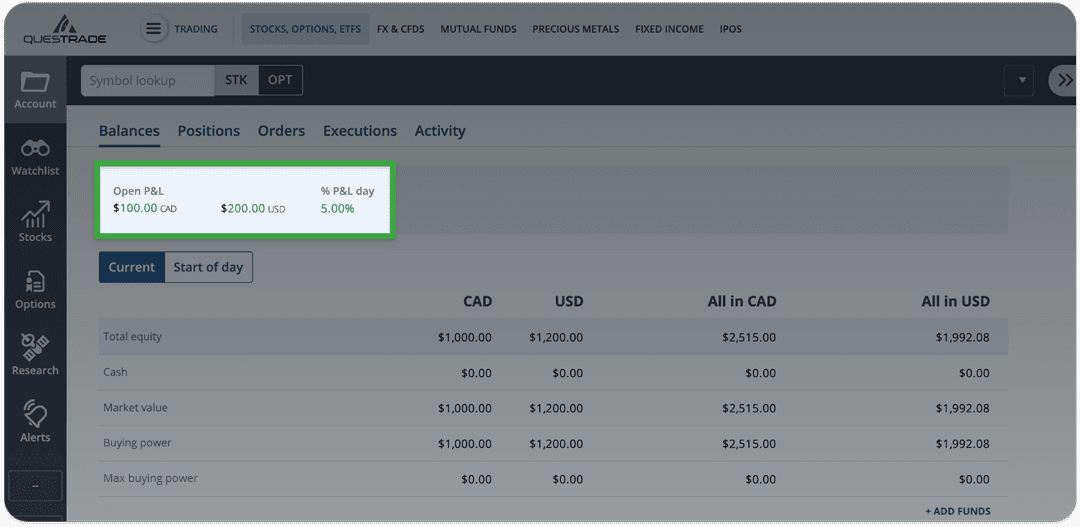
This is the ‘gadgets’ widget, which is fully customizable. You can also view your balances here.
Next, let’s quickly go over our P&L figures near the top of the page
Reading the balances table
This button allows you to switch between viewing your current and start of day balances.
These are your balances represented in each currency: CAD & USD.
All in CAD, and All in USD are the approximate values if you were to convert to a single currency.
Please note: Your approximate All in CAD, and All in USD balances for Buying power and Max buying power are shown with a small currency conversion buffer to protect against overnight currency market fluctuations. For more information on this buffer, please check out the section below.
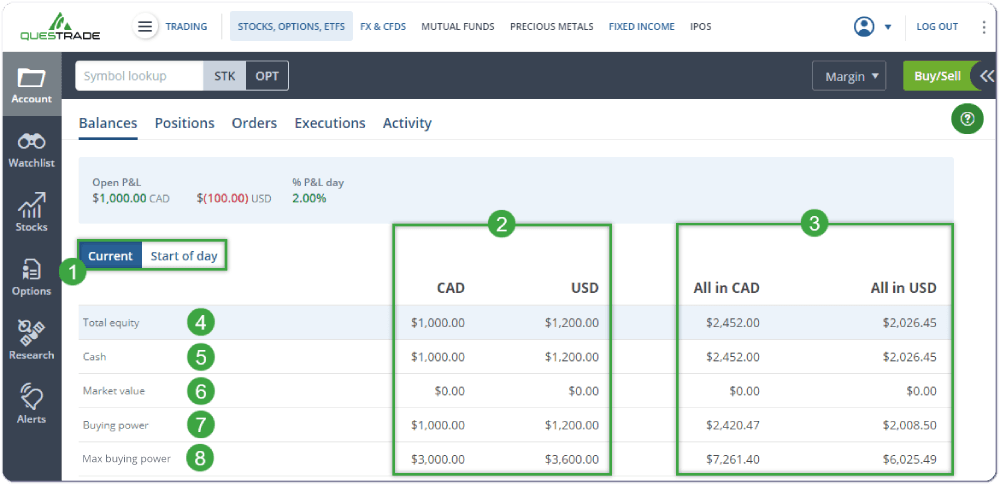
Total Equity represents the market value of your investments + your cash
This is shown as a separate CAD & USD balance
And is also shown as an approximate value, if you converted to a single currency under “All in CAD/USD”
Cash simply shows how much liquid, or available cash you have
Market Value represents the current value of all your investments
The CAD and USD columns represent separate investments in each currency
The All in CAD/USD columns represent the approximate value if you converted to a single currency.
Buying power only applies to Margin accounts, and shows how much ‘excess margin’ you have in the account.
In a registered account, your Buying power is equal to your cash. Except in the case of currency conversions where the buffer is applied.
We’ll cover this in more detail in the section below.
Max buying power also only applies to Margin accounts.
This represents the amount of money you could theoretically borrow from Questrade to trade or invest with in your Margin account.
In a registered account, your Max buying power is equal to your cash. Except in the case of currency conversions where the buffer is applied.
We’ll also cover this in more detail below.
Buying power explained
Buying power only applies to margin accounts. You are still shown a buying power figure for registered accounts, but it will equal your cash balance(s) (Except in the case of currency conversions due to the buffer) since you cannot ‘borrow’ or leverage in registered accounts.
This figure represents the amount of available equity in your account that you can borrow against. You can think of buying power as the amount of excess margin you have available to trade with.
Your buying power values show how ‘close’ you are to a margin call.
A Margin call is when the value of your borrowed investments + available cash is less than the required equity (used as collateral for the loan) in the account. This is when your buying power is less than $0.
You can calculate your buying power manually if you’d like, it’s your cash plus the value of your investments minus the margin requirements.
Here’s the formula: Buying power = Total equity(Cash+Market Value of investments)- Margin requirements(Market Value of investments*Margin requirement)
You can view the specific margin requirement or M.R. for each investment in the Level 1 quote window on the trading platforms.
And here’s a few examples:
Example 1:
You deposit $10,000 CAD cash to your new margin account, and have not made a trade yet. Your cash equals $10k, market value is $0, therefore your buying power is equal to your cash at $10,000 CAD.
Example 2:
With your $10,000 deposit from earlier, you buy $20,000 of stock ABC with a margin requirement of 30%.
Your cash balance now equals -$10,000, and the market value of your investments equal $20,000. Therefore your total equity is still $10,000.
The margin requirements are $20,000 * 30% equaling $6,000.
We subtract the margin requirement from your equity, therefore your buying power is now $4,000.
Example 3:
Continuing from the earlier scenario, your $20,000 investment unexpectedly declines in value by 10% to $18,000.
Your cash balance is still -$10,000, but now your total equity is $8,000.
Your margin requirement is $18,000 * 30% = $5,400.
We subtract the margin requirement from your equity, therefore your buying power is now only $2,600.
Example 4:
With some bad earnings news, your $18,000 investment from the earlier example declines in value by another 25% to $13,500.
Your cash balance remains unchanged at -$10,000, but now your equity is $3,500.
Your margin requirement is $13,500 * 30% = $4,050.
Therefore, your buying power is now -$550, and you are in a margin call, and need to deposit funds, or sell shares to bring this value up to a positive amount.
These examples also highlight the consequences of leverage (borrowing) while trading. In these scenarios, because we leveraged our cash by 2x to purchase the initial investment, our losses were magnified 2x.
With a -10% decline in share price, your account would be down -20%. This does however go both ways, with a +10% gain, your account would be up +20%.
Note: Using borrowed money to finance the purchase of securities involves greater risk than using cash resources only. If you borrow money to purchase securities, your responsibility to repay the loan and pay interest as required by its terms remains the same even if the value of the securities purchased declines.
Max buying power explained
Your Max buying power represents the possible maximum amount you could borrow from Questrade to trade and invest with. The max buying power is calculated using a 30% margin requirement - the lowest possible requirement as per CIRO regulations.
Your Max buying power is your buying power multiplied by 3.333 (Representing a 30% margin requirement).
Therefore if your buying power is $1,000, your max buying power is $3,333.
Please note: Because every specific investment may have a different margin requirement, your max buying power shown may not actually be the maximum amount you could purchase of a specific investment. For securities with a 100% margin requirement for example (common for OTC stocks), your max buying power equals your cash since you cannot borrow to buy that security.
You can view the margin requirements for any security in the Level 1 quote window.
In addition: Please use caution when investing the full amount of your max buying power to purchase on margin. For example, if you borrowed heavily to invest, your buying power could be very close to $0. If your investment declines in value by any amount, you’d immediately be in a margin call. Please see the section above for more details.
Currency conversion buffer explained
Your All in CAD, and All in USD balances represent the approximate combined balances in your account if you were to convert to a single currency. The balances shown for your combined Buying power and Max buying power also have a 2.25% ‘buffer’ applied to the USD/CAD foreign exchange rate to account for any market fluctuations.
This buffer is to protect registered accounts from entering a negative cash balance when trading and converting currencies, or to prevent your Margin account from having a negative equity balance if it incurs losses that are affected by currency rate changes between USD/CAD.
Due to CIRO regulations, registered accounts like a TFSA or RRSP cannot hold negative cash balances overnight. Without this buffer, if you were to maximize your buying power and placed a trade that required currency conversion, due to constantly fluctuating foreign exchange rates between CAD and USD, once your currency was converted, you could end up in a negative cash balance.
This ‘buffer’ does not affect how much Cash or Equity is shown in your account. This only applies to the approximate All in CAD, and All in USD columns for Buying power and Max buying power.
Let’s check out some examples to explain further:
Example 1: Registered account
In this example, we hold a $1,000 CAD cash balance as shown in the top left field, and have not made any investments or trades yet.
Your combined "All in" Cash/Market value and Total equity are based on the closing USD/CAD rate of the previous business day
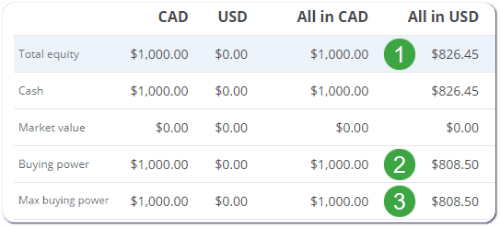
Your Buying power and Max buying power are based on the closing rate of the previous day adjusted for the FX buffer
Suppose the USD/CAD exchange rate is 1.21, if we were to convert our CAD cash to USD, it would be worth $826.45.
The Buying power shown here in the All in USD column has the currency conversion buffer of 2.25% applied to the rate of 1.21, rather than displaying the same value as your approximate USD cash/equity above.
The Max buying power also has the buffer applied, this simplified example shows a registered account where the Max buying power is equal to the Buying power.
The buffer prevents fluctuations in the USD/CAD excdhange rate from causing a negative cash balance once the currencies are converted overnight.
Example 2: Margin account
Suppose we hold a $1,000 CAD cash balance, and a -$100 USD balance after a few trades.
Your All in CAD and All in USD balances for your Total equity and Cash rows are simply the approximate total converted values.
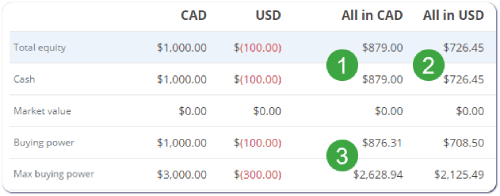
In this example, since there’s a negative cash balance on the USD side, your ‘All in CAD’ = CAD cash + USD cash converted to CAD.
$1000 CAD + [-$100 USD *1.21 (exchange rate)] = $879 CAD
Likewise, your ‘All in USD’ = USD Cash + CAD cash converted to USD.
-$100 USD + [$1,000 CAD *1.21 (exchange rate)] = $726.45 USD
The Buying power and Max buying power rows have the currency conversion buffer applied. With this buffer, when you place a trade, it decreases the chance of currency fluctuations causing a negative balance unexpectedly.
Note: The actual Cash & Market value balances in your account are not affected by this conversion buffer.
This is only for display purposes in the Buying power and Max buying power rows to prevent the likelihood of an unexpected negative cash balance (caused by exchange rate fluctuations) in your registered account, or a negative equity balance in a margin account.
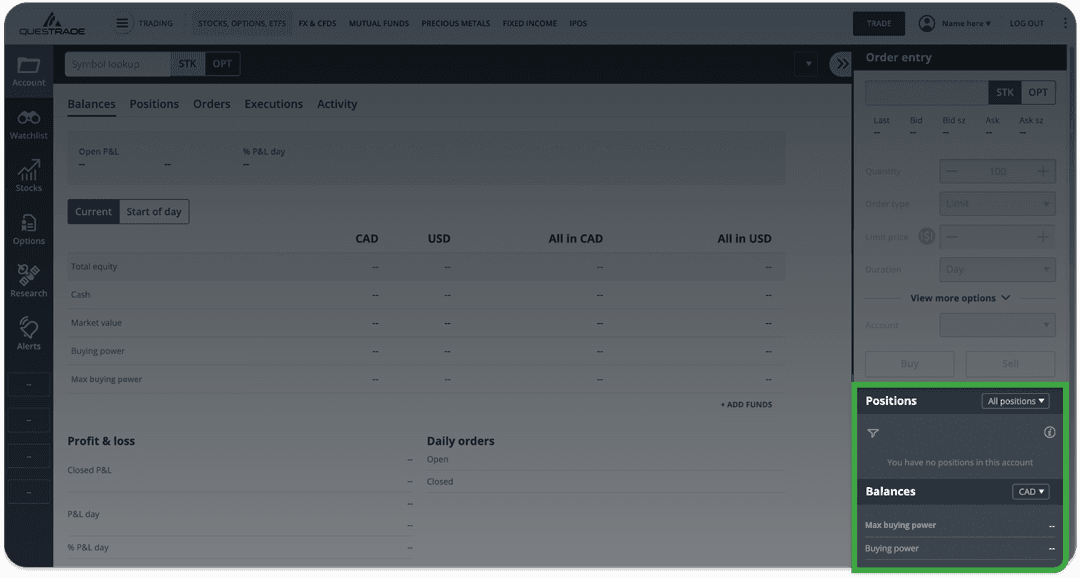
Positions
The positions tab on your trading platform allows you to conveniently track and manage your investments. From this tab, you can view your open and closed positions, average price, market value, and much more. "Positions" is just another way of saying your investments, or your holdings.
You can also customize your positions page both within Edge Web and Edge Desktop. In addition, we offer filtering and searching tools if you happen to manage a large portfolio, and for options traders, you can even choose to group by strategy.
The positions page
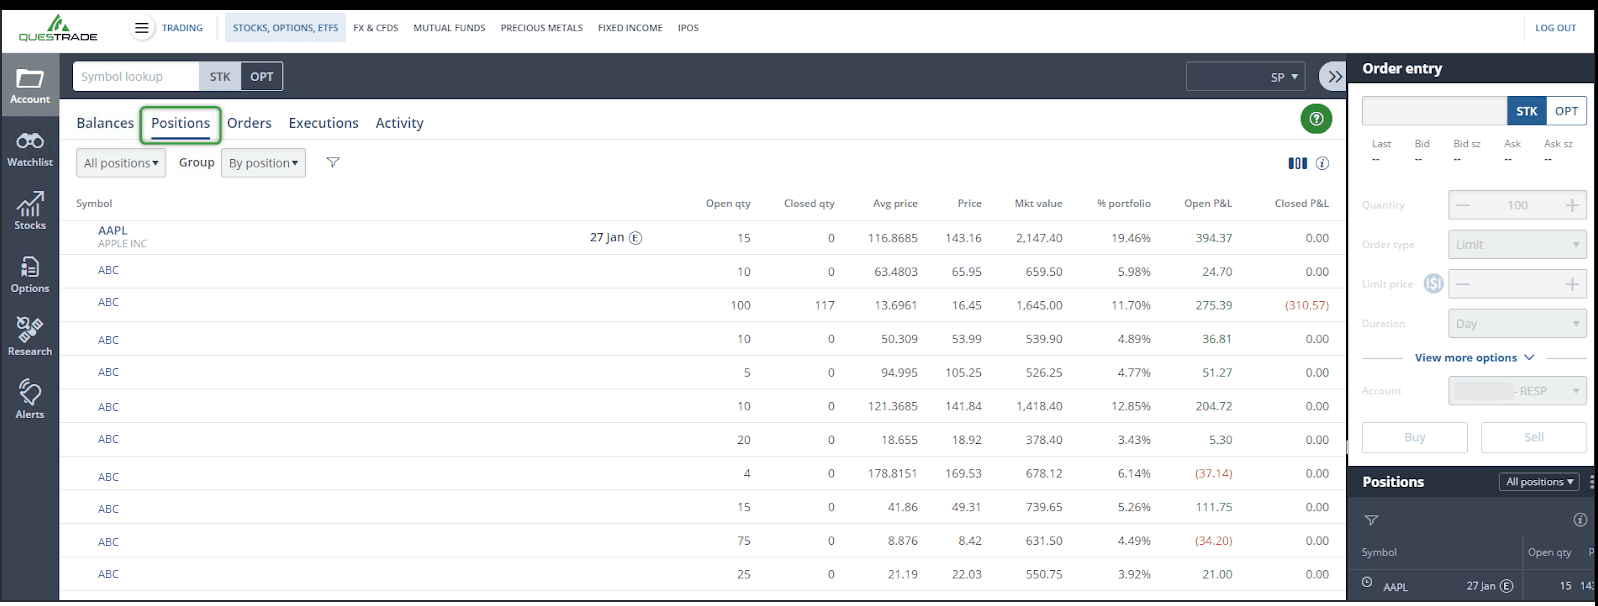
On the positions page by default, you’ll see 9 columns, each displaying a different set of information.
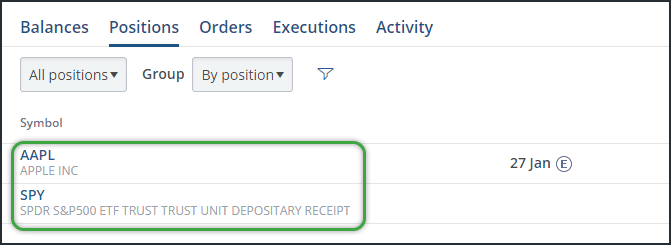
Symbol
The first column you’ll see is the Symbol (also known as the ‘ticker’). In this column, you’ll also see the full company name, or for an ETF investment, the name of the ETF company and/or trust.
Beside the ticker and description, you may also see icons representing actions or events related to the investment.
These are the icons found next to the symbols in the columns, and what they mean:
Open qty and Closed qty
Open quantity represents how many shares you currently own (Or owe if shorting) of a particular position. Whereas Closed quantity represents how many shares you’ve sold (Or bought to cover if shorting).
Another way to think about this is as “unrealized” vs. “realized”. Open quantities of positions fluctuate in value, however once you’ve closed your position, the gain/loss is realized or locked-in.
Note: Once you completely close your position, and your Open qty is 0, this symbol will disappear from the Positions tab the next trading day. You can track your historical trades by clicking “Activity” in the Account menu.
Avg price
The average price shows you the price at which you bought or shorted the investment. Buying more shares at a different price point can either “Average up” or “Average down” your overall price.
For example: If I buy 10 shares of XYZ at $10/share, then buy another 10 shares at $15/share, my average price for 20 shares would be $12.50/share.
Note: “Average Price” may not reflect correctly on your trading platform with certain transactions in your Questrade account (i.e. transfer-ins, stock-splits or other corporate actions). Please review your statements for accuracy, and report discrepancies to Questrade as soon as possible when issues are identified. Please see Average price and adjusted cost base.
Price
This column represents the current price per share in the open market.
Mkt value
The current market value of your position. The number of shares you still own/owe from your Open qty multiplied by the current share price.
% portfolio
How much of your overall balance is invested in this specific security. This will grow or shrink depending on how the market value fluctuates.
Open P&L
Your current open, or unrealized profits or losses for this specific security. Once you sell your shares or cover your short investment, this value is then shown in Closed P&L.
Closed P&L
Your locked-in, or realized, gains or losses for this specific investment.
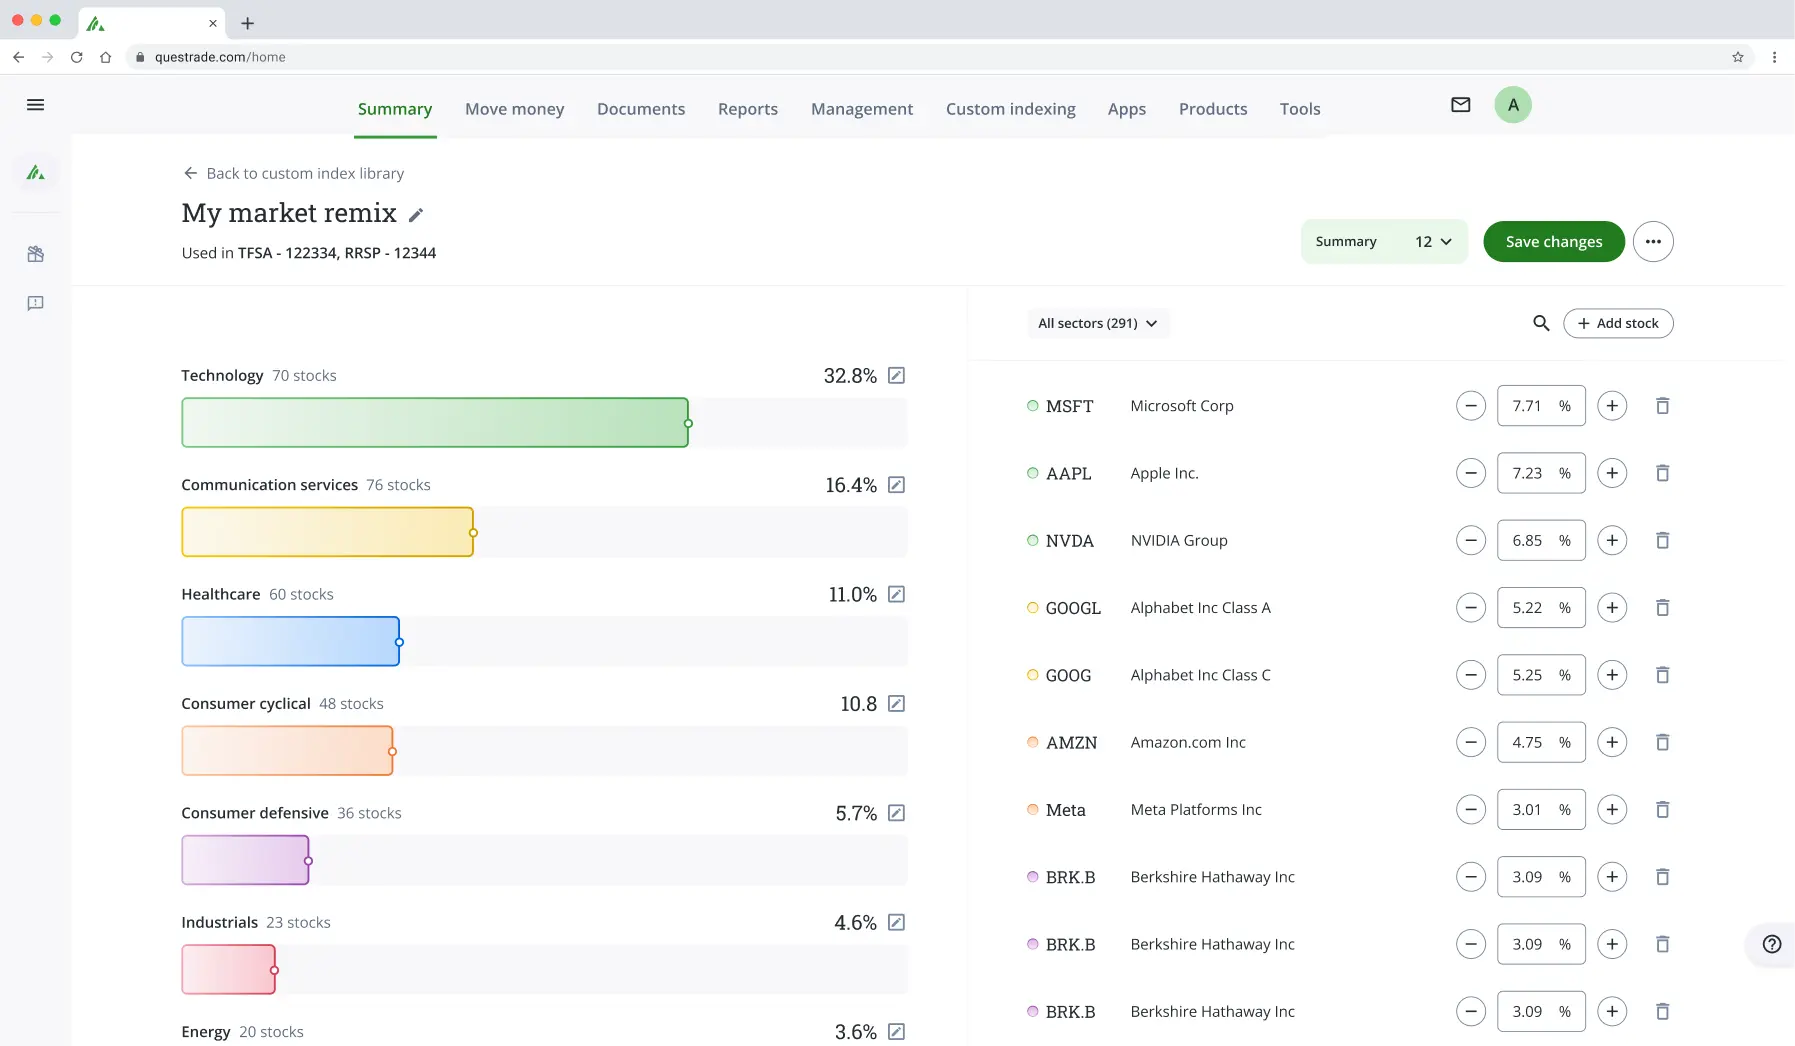
Customizing your positions page
On the positions tab, you can add additional columns, and filter your view to show only specific securities.
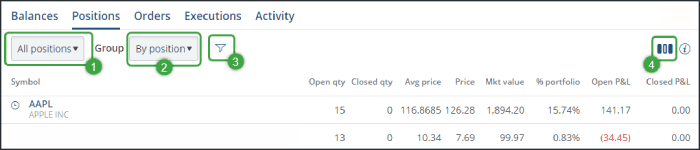
Click here to filter by security type (Stocks/ETFs, Options, and more)
Here you can group by position, underlying or strategy, this can be useful for Options trading specifically.
Click this icon to filter/search for a specific ticker symbol. This can be incredibly useful if you manage a very large portfolio.
To add or remove columns, please click the small icon on the top right
You can also shift the order of the columns by clicking the + or -- buttons in the pop-up
Additional columns
Here are the detailed explanations of all the other columns available in the positions page, organized in alphabetical order:
% P&L
Your profit or loss since buying/shorting the security shown as a percentage.
% P&L day
Your profit or loss since market open (9:30 am ET) shown as a percentage.
Book value
The market value of the position when you bought or shorted it. This is calculated as your Avg price multiplied by your Open qty.
Currency
The currency the position trades in.
Date/time
The specific date/time the position was added. (Bought or shorted)
Days to exp
For options contracts specifically, this indicates how many days are left until the contract expires.
Delta
For options specifically, a ratio comparing the change in price of the underlying asset to the change in price of the derivative.
This column is available for single options, and the parent and child rows of options strategies.
For example: If an options contract has a delta of 0.65, this means that if the underlying stock increases by $1 a share, the options contract will rise by $0.65 per contract. (Everything else being equal)
Description
The full name of the specific symbol. Note: This is already shown under the ticker symbol in the default column on the left side.
Earnings date
The estimated earnings date for a stock. This is shown once the company has confirmed their earnings date.
Entry price
The fill price of the most recent transaction for this specific security.
Exch
The exchange this investment trades on (NYSE, TSX, etc.)
Expiry date
For options contracts specifically, the date the contract will expire worthless.
Gamma
Gamma is a derivative of the Delta. This measures the change of the option’s delta resulting from a change to the underlying stock price.
Gamma is greatest when the option is at-the-money, and decreases the further away the option is from being either in-the-money, or at-the-money.
The calculation of gamma is fairly complex and requires complex spreadsheets or software to find it’s value, but let’s show an approximate example:
Say you have a call option with a delta of 0.4, if the underlying increases by $1, the option will increase in value by $0.40, and its delta will also change after this price move on the underlying. After the $1 increase let’s assume the option’s delta is now 0.53. The 0.13 difference between the “first” and “second” delta can be considered an approximate value for Gamma.
Implied volatility
The estimated expected volatility of the security’s price, shown as a percentage. A higher volatility means a more unstable security price.
This field is available for single options and the parent and child rows of options strategies.
In-the-money
Shows if the options contract is in-the-money. This field is available for single options, and strategies’ child rows. It will be blank for the parent row for a strategy.
Option style
Shows if your options contract is an American or European style option.
Option type
For single-leg options, this shows whether the option is a call or a put. For multi-leg options and strategies, the parent row will be blank, and each child row will display the corresponding option type for each strategy leg.
P&L day
Shows today’s (since market open) profit or loss for this position shown as a dollar value.
Rho
Measures the rate of change of an option’s price resulting from a change in the risk-free interest rate. Rho measures the ‘sensitivity’ of an options contract relative to a change in the risk-free interest rate . This field is available for single options, and the parent and child rows of options strategies
For example: If an option has a Rho of 1.0, then for every 1 percentage increase in the risk-free interest rate, the value of the option would increase by 1%. Options that are most sensitive to interest rate changes from the central banks are those that are at-the-money, and with the longest time to expiration.
Security ID
The unique identifier number assigned to this specific position.
Security type
Shows what type of security this position is. (Stock, ETF, Option..)
Strike
The price at which your options contract can be exercised. This field is blank for options strategies in the parent row, but each child row and leg of the strategy will have the strike price shown.
Theta
Measures the daily rate of decline in an options contract due to the passage of time. This is also known as the measurement of “time decay”. The further away in time you are from expiry, the more “time-value” an option will have. This field is available for single options, and the parent and child rows of options strategies.
For example: If the theta is -0.05, the options contract price will decline by $0.05 each day
Vega
Vega is the measurement of an option’s price sensitivity compared to changes in the volatility of the underlying asset. As the volatility of the underlying asset increases, so does the value of the option. Vega is the change in the option’s price compared to every 1% change in volatility.
For example: If the value of an option is $7.50, implied volatility is at 20%, and the option has a Vega of 0.12. If the Implied volatility moved from 20% to 21.5%, this is a 1.5% volatility increase. Therefore the option’s value will increase by 1.5(Vol) * 1.2(vega) to $7.68.
Side menu
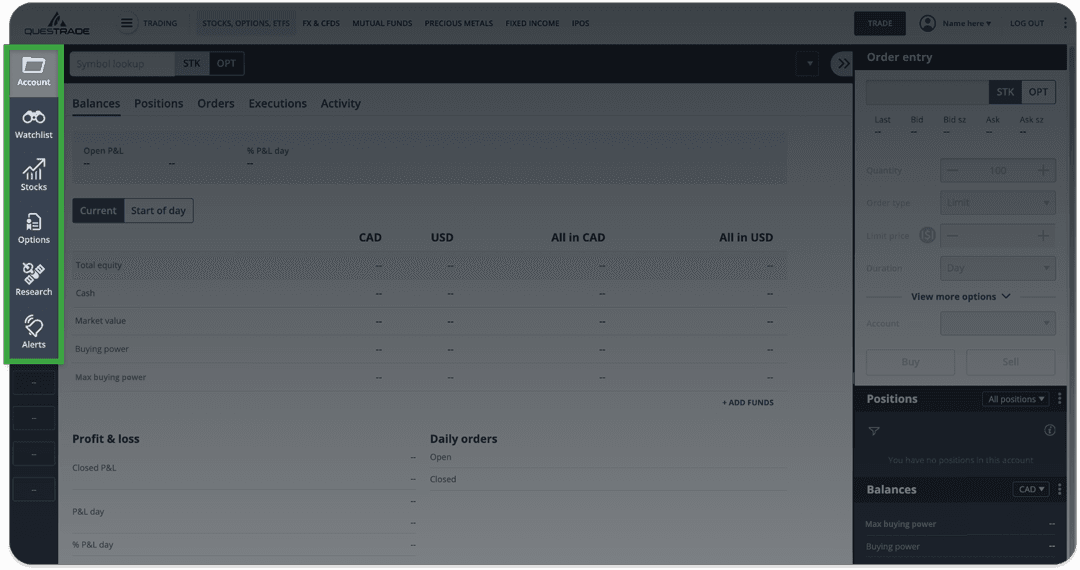
Account
View balances, positions, orders, executions, and activity.
Access pre-made watchlists or create customized watchlists.
Stocks
View detailed information about specific stocks, ETFs, or indices.
Includes TipRanks Smart Score, Analyst Ratings, and News analysis
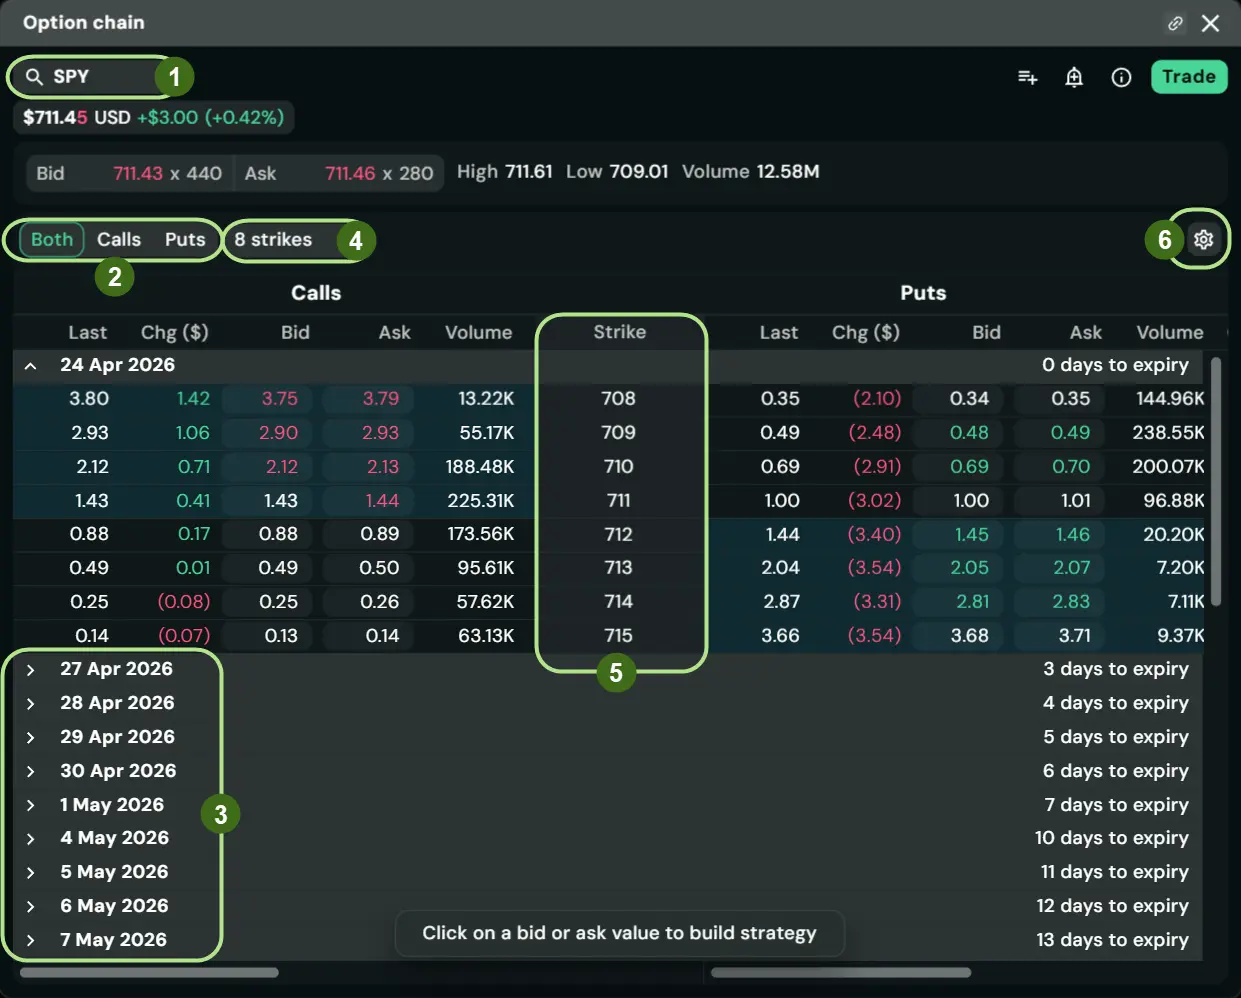
Options
View detailed information about options.
Research
Access market event calendars, news, and videos.
Alerts
Customize email and SMS alerts for specific symbols.
Profit and loss
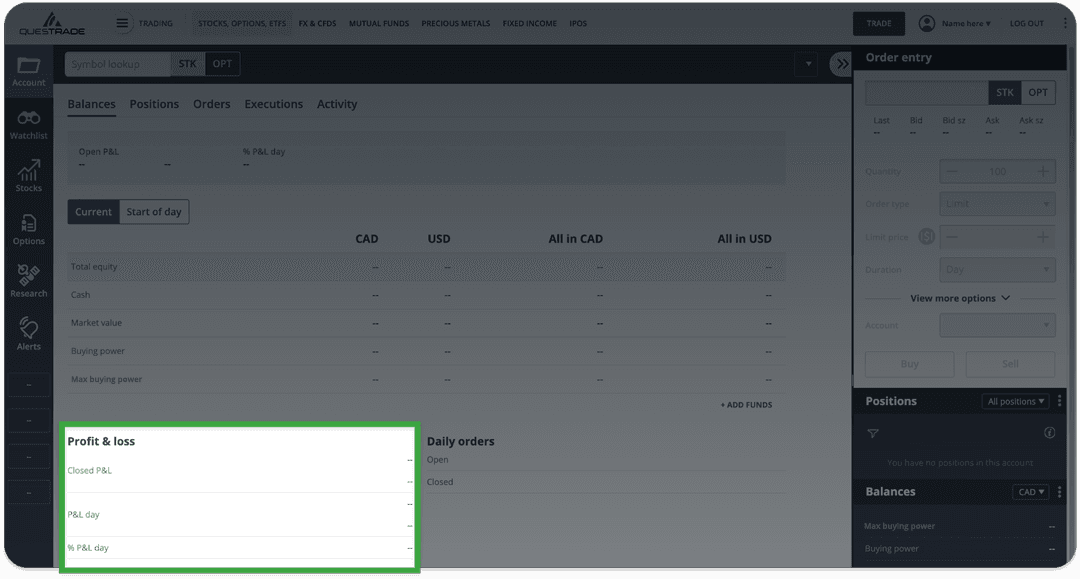
Closed P&L
Represents the profit and loss (P&L) values of closed positions in your account.
This includes positions that were completely closed in the current day, and positions that were previously partially closed.
P&L day
Today’s profit (or loss) for open positions in your account, compared to the previous trading day’s values.
% P&L day
Today’s profit (or loss) for open positions in your account (expressed as a percentage), compared to the previous trading day’s values.
Daily orders
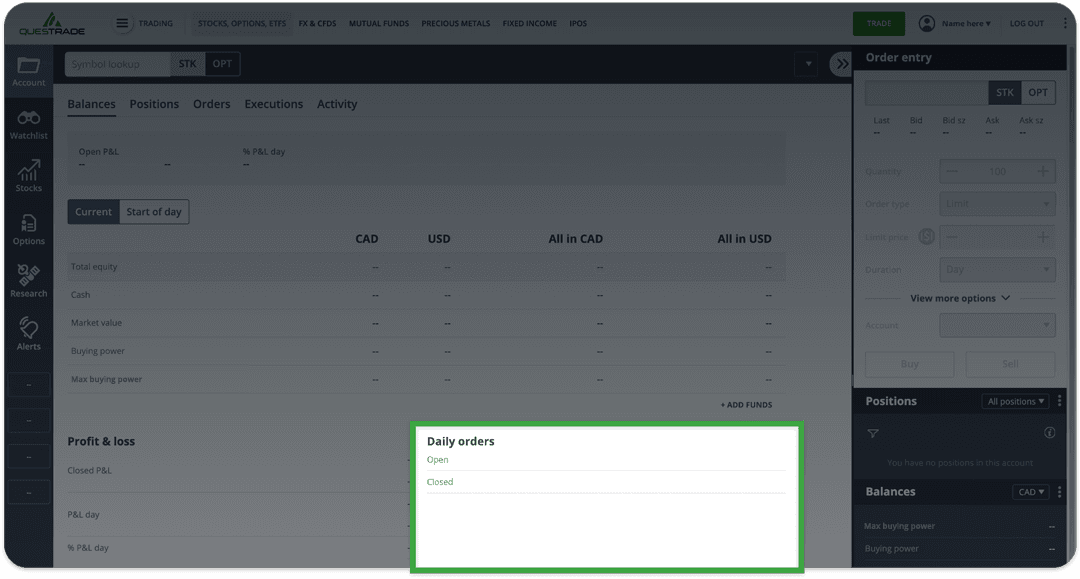
Shows the number of orders for the day, including open (waiting to be executed) and closed (executed) orders.
Order entry
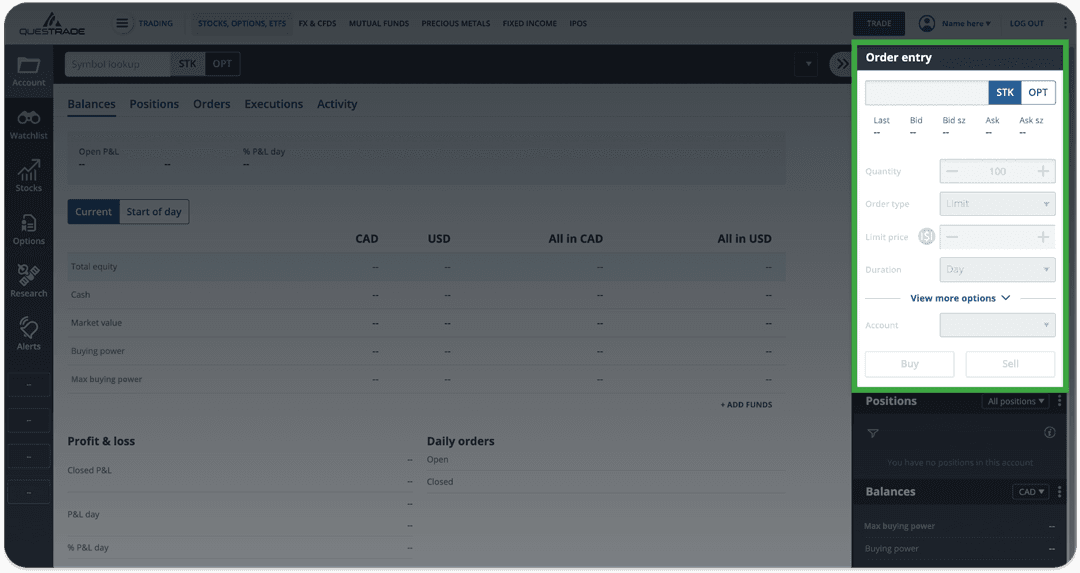
Where to buy or sell securities.
Gadgets
Add gadgets to your preference. They will always be visible while you navigate the rest of the platform on the left.
Watchlists
To create a watchlist:
Log in to Questrade Edge Web
In the main toolbar, click/tap Watchlist
Click/tapUser-added image, and then Manage watchlists
Select + Add watchlist to create one
To keep your platform organized, name your watchlist
Once the watchlist is created, click/tap + Add Symbol to add securities of your choice
Later, if you decide to add or remove securities from your watchlist, click/tap

, and then edit this watchlist. To add, remove or manage your watchlists, click/ tap
, and then click/tap Manage watchlist.
By default, our platform shows you key information about the securities you add to your watchlist; for example, last price, bid, ask, change, mini-charts, high & low of the day, and volume. However, you can customize the data that appears in your watchlist by clicking/tap

For an explanation of the different data feeds, see below.
Column | Description |
|---|---|
Symbol | The ticker symbol for the security |
Description | The full name of the security |
Last | The last price the security was traded at |
Chg $ | The change in price from the previous day’s closing price |
Chg % | The change in price from the previous day’s closing price, expressed as a percentage |
Bid | The highest price the market is willing to pay for this security |
Ask | The lowest price the market is willing to accept for this security |
High | The highest price traded for the security today |
Low | The lowest price traded for the security toda |
Vol | The trading volume for the current day |
Exch | The listing exchange for the security |
Bid sz | The number of shares in board lots the market is willing to purchase at the bid price. On Canadian markets, one board lot is 100 shares for securities valued over $1.00, 500 shares for securities valued between $0.10 and $1.00, and 1,000 shares for securities valued under $0.10. On U.S. markets, one board lot is 100 shares for all securities. For option orders, one board lot is one option contract |
Ask sz | The number of shares in board lots the market is willing to sell at the ask price. On Canadian markets, one board lot is 100 shares for securities valued over $1.00, 500 shares for securities valued between $0.10 and $1.00, and 1,000 shares for securities valued under $0.10. On U.S. markets, one board lot is 100 shares for all securities. For option orders, one board lot is one option contract |
Tick | A change in the security’s price from the previous trade is represented by an up or down arrow. No change is represented by a dash |
Open | The price the security traded at when the markets opened |
Prev close | The price the security traded at when the markets closed the previous trading day |
Currency | The currency of the security |
Last trade | The date and time the security was last traded at |
52w high | The highest price the security traded at over the past 52 weeks |
52w low | The lowest price the security traded at over the past 52 weeks |
Mkt cap | The total value of all outstanding shares of the security |
Avg vol | The average trade volume over a 3-month period |
Shares | The number of shares owned by the public, company officers, and insiders |
EPS | Earnings per share: a company's profit divided by its number of common outstanding shares |
Div | The distribution of a security’s earnings to shareholders |
Yield | The income return on an investment displayed as an annualized percentage |
Ex-date | The date on or after which a security is traded without a previously declared dividend or distribution |
Security type | Indicates the type of security (e.g., stock, ETF, option) |
Open interest | The total number of option contracts that are not closed or delivered for the current day |