Introduction to charting
Published: Nov 19, 2021
Updated: Apr 04, 2022
Learn the very basics of how charting plots out data over time.
The prices of securities are constantly changing during market hours. While you can track price changes at any point in time using real-time market data, if you want to see patterns on how those prices change over time or in relation to other variables, you’ll need to use charts.
What is a chart?
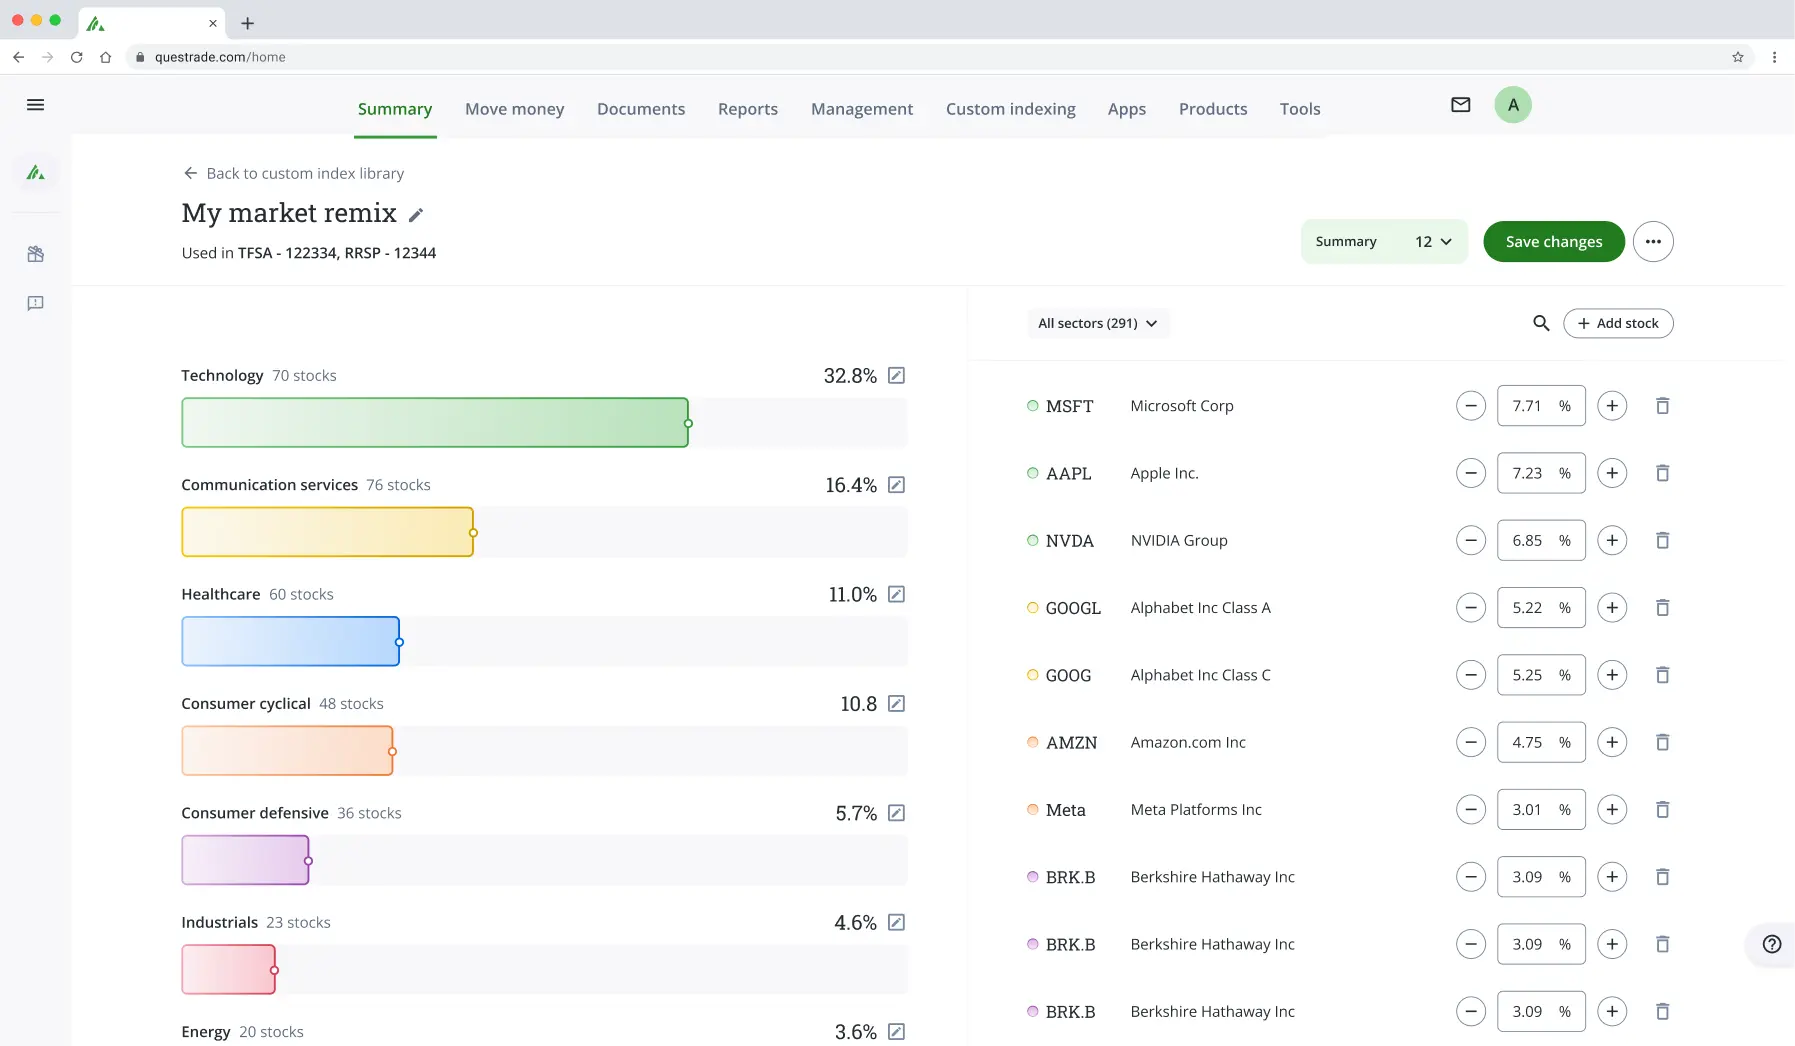
In its most basic form, a chart tracks data about a particular security over time, allowing you to see any patterns that might arise visually.
You glean some information from the chart itself, and you can also make use of drawing tools, which allow you to plot patterns on the charts that you can use for your own investment analysis.
You can see a brief introduction to how to use charts here: (opens in a new tab)
What charts does Questrade offer?
There are 3 main type of charts offered on our Edge Web platform:
Chart Type | Description |
|---|---|
Candle-style | A candle-style chart displays each unit as a candle. A candle is composed of two wicks (two lines) and the body (rectangle). One candle will tell you the following information: opening price, closing price, high price, and low price. The body color is based on whether the open is higher than the close or vice versa |
Open high low close (OHLC) bars style | An OHLC bar chart consists of centrelines connecting high and low prices for the specified frequency. Bar width corresponds to the time interval. Open and close prices are displayed as horizontal lines projecting to either side of the centreline. By default, negative and positive trends appear in different colours |
Mountain style | Mountain style (also known as Area style) connects all close prices with a line and colours the area underneath. The area included is highlighted with a different colour |
In addition to the charting with our platform, we also offer additional tools such as Intraday Trader (powered by Recognia) which can scan and flag technical trade set-ups as they occur in real-time.
Does Questrade integrate with other research platforms for additional charting functionality?
We’ve been working hard to integrate some of the most popular third-party tools available with our platforms (via our secure API) to let you benefit from all their functionality as well.
Questrade offers a secure API to connect industry leading tools such as VectorVest and Medved Trader to your account without ever exposing your login information.
To learn more about Questrade’s API and the partners we work with, check out our API Centre.