Understanding drawing tools
Published: Oct 17, 2022
Updated: Oct 20, 2022
Learn about technical analysis methods including drawing tools, chart patterns and more.
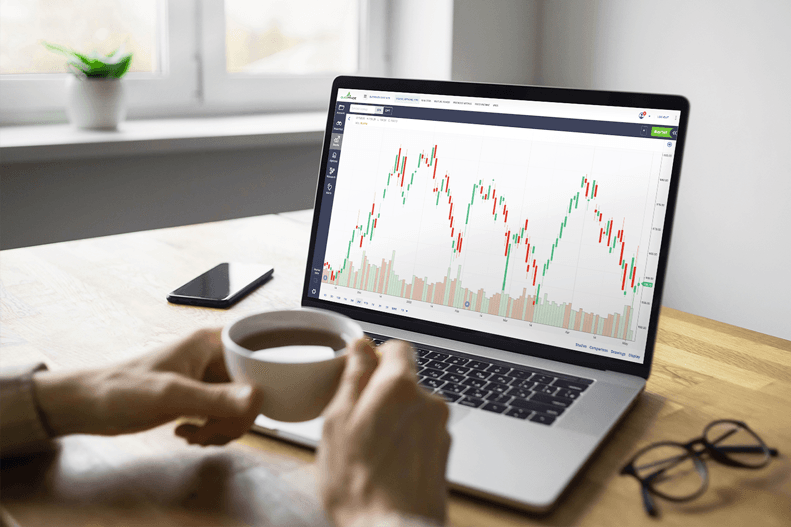
Whether you’re an active trader or are just learning how to review stock price movements on a chart, Questrade Edge platforms offer a variety of drawing tools to help you analyze a stock’s current, past and future performance.
When analyzing stock performance using drawing tools, investors typically look at two things: support and resistance levels.
A support level is a point in a downtrend (when prices are decreasing over time) where there’s an expected pause in the price decline due to an increase in investor demand for a stock. For example, when the price for a certain stock continues going down, investors can see that as an opportunity to buy which increases the demand for that stock. There comes a point where it reaches a saturation of demand and breaks the downtrend, thus forming a support level (and prices start to go up).
In contrast, a resistance level is a point in an uptrend (when prices are going up over time) where there’s an expected pause due to a decrease in demand from investors. When a price for a stock “peaks” at a certain point, investors can find opportunities to sell. Once investors start selling at that point, the uptrend breaks and forms a resistance level (and prices and demand start to go down).
Now that you know what investors typically look at, below are the tools available in Questrade Edge Web.
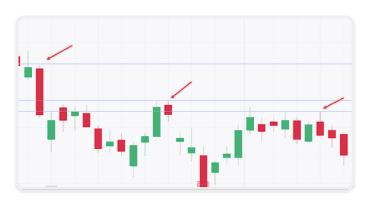
Trend lines
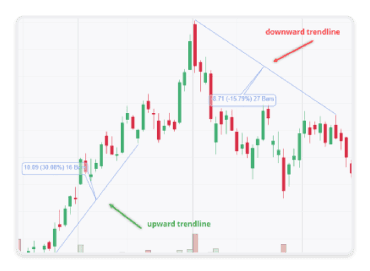
Trend lines are upward or downward lines that can indicate price trends of a security over a period of time. Typically, it can show a pattern of increasing or decreasing demand for a security based on support and resistance levels.
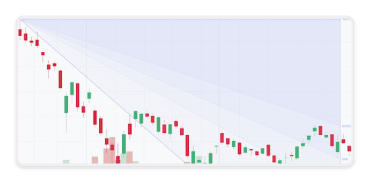
Trend channels
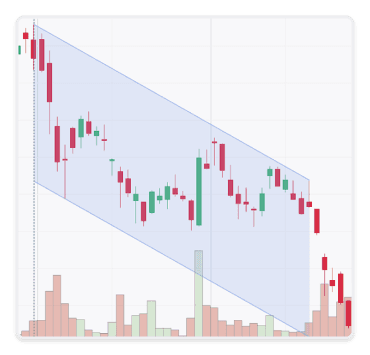
Trend channels are pairs of parallel straight (trend) lines that can cover price movements over a period of time. Breakouts above or below a channel can assist in determining its future price.
Ellipse
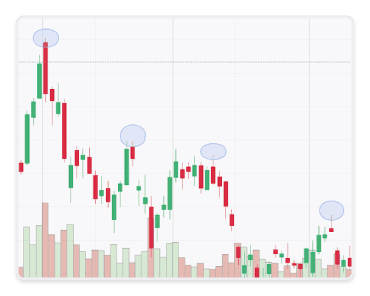
The ellipse tool allows you to draw ovals or circles to mark price changes, gaps, and peaks. You can also use it to anticipate a stock’s downward or upward trajectory.
Rectangular
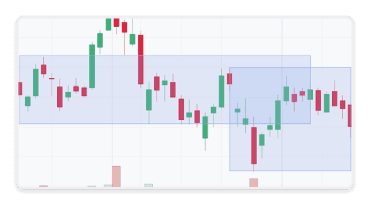
Rectangle allows you to highlight significant support and resistance segments on a chart.
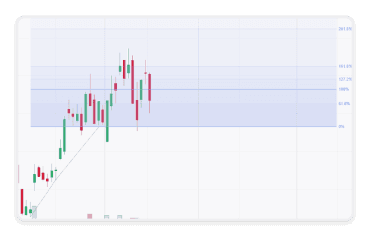
Fib Arc
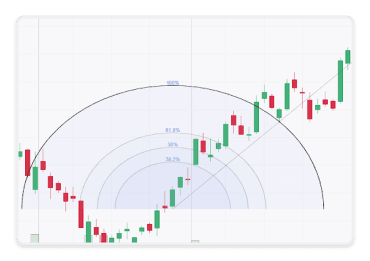
Fib (or Fibonacci) Arc allows you to draw an “arc” to trace breaking points of support or resistance levels using Fibonacci sequence (opens in a new tab) (opens in a new tab) (of 38.2%, 50%, 61.8%, 100%).
Fib fan
Fib (or Fibonacci) Fan allows you to draw a “fan” to trace breaking points of support or resistance levels using Fibonacci sequence (of 38.2%, 50%, 61.8%, 100%).
Fib Retracement
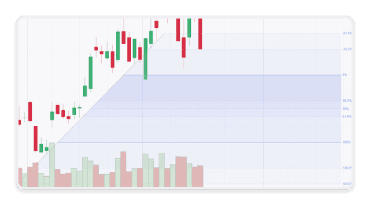
Fib (or Fibonacci) Retracement allows you to draw trendlines to trace breaking points of support or resistance levels using Fibonacci sequence (of 38.2%, 50%, 61.8%, 100%, 138.2%, 161.8%).
Fib Projection
Fib (or Fibonacci) Projection allows you to draw three-lined projections to trace breaking points of support or resistance levels using Fibonacci sequence (of 38.2%, 50%, 61.8%, 100%, 138.2%, 161.8%).
Horizontal
Horizontal lines can be used to mark different price points of a security (including support and resistance levels) over any period of time.
Vertical
Vertical lines allow you to mark specific dates on a chart over any period of time.
Please note: You can also find these drawing tools (except vertical and horizontal) in Questrade Edge Desktop.
To learn more about advanced charts and technical studies, please check our article above.
