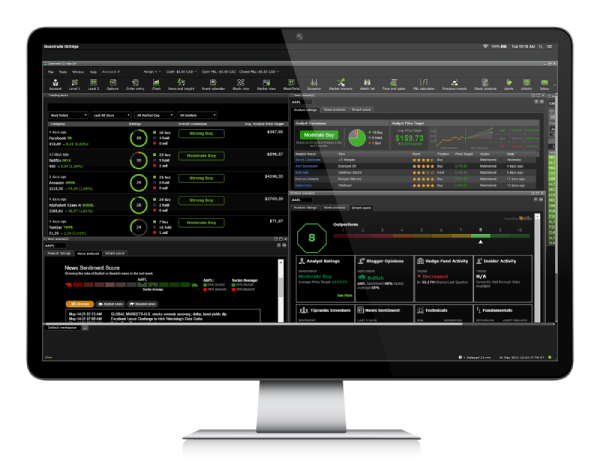
Performance Dashboard: Track and understand your trading performance in Questrade Pro
Published: Jul 15, 2026
What is Performance Dashboard?
Performance Dashboard is a widget in Questrade Pro that gives you a multi-dimensional view of how you trade. Instead of just showing whether you're up or down, it surfaces the patterns behind your results — the days you trade well, the habits that cost you, and the wins worth repeating.
It tracks eight key metrics and presents them in a single, easy-to-scan view. Whether you're a frequent trader looking for an edge or someone who simply wants a clearer picture of your progress, Performance Dashboard gives you more to work with than a portfolio balance alone.
Tools like this are typically paywalled on other platforms. In Questrade Pro, it's included at no extra cost.
Where to find it
Performance Dashboard is available as a standalone widget in Questrade Pro.
Log in to Questrade Pro.
Select ‘Add widget’ on the top navigation bar
Click on ‘Performance’ and select ‘Performance Dashboard’
Note: A limited version of Performance Dashboard previously existed inside another widget. This standalone version is fully built out with expanded metrics and a dedicated interface.
Your metrics, explained
Each metric tells you something different. Together, they tell the full story of your trading.
Daily journal
A calendar view of your daily performance. Spot patterns in when you trade well and when you don't — by day of week, after winning streaks, or around specific market events.
Trade Win %
The percentage of your trades that close in profit. A useful starting point, but not the whole picture — a high win rate with poor risk management can still lose money over time.
Profit Factor
The ratio of your total gains to your total losses. A Profit Factor above 1.0 means your wins are outweighing your losses. Use this alongside Trade Win % for a more complete read on your strategy.
Realized P&L
Your actual, locked-in profit or loss from completed trades. Unlike unrealized P&L, this number doesn't fluctuate — it reflects what you've actually earned or lost.
ROI
Return on Investment: the ratio of your return to the capital you deployed. Reveals how efficiently each dollar you put to work is performing.
R-Multiple
The ratio of reward to risk on your trades. A positive R-Multiple means you're consistently earning more than you risk. A common benchmark for disciplined traders is an average R-Multiple above 1.0.
Total Equity Chart
A visual of your equity and profit growth over time. Lets you see your trajectory — not just a snapshot — so you can track whether your overall performance is improving.
How to read your metrics together
No single metric tells the full story. Here's a practical way to work through them:
Start with Trade Win % — it's the number most traders check first. But don't stop there.
Check your Profit Factor. Even with a strong win rate, losses that outweigh wins will drag your results. Profit Factor tells you whether your strategy holds up under pressure.
Look at Realized P&L and the Total Equity Chart together. They answer the question: how are your trades performing from one day to the next?
Open the Daily journal. The calendar view shows when you trade well — and when you don't. If your red days cluster around Fridays, or right after a winning streak, that's a pattern worth knowing.
Check your R-Multiple and ROI. These reveal whether the risk you're taking is actually worth it, and how efficiently your capital is working.
Keep # of Trades in mind as context. A small sample size can make any metric look better or worse than it really is.
Filtering your results
You can adjust the timeframe displayed in the Performance Dashboard to focus on a specific period — the last 30 days, a quarter, or a custom date range. Use this to compare how your trading has evolved over time, or to isolate a specific period you want to review.