The volatility index (VIX) playbook smart investors need
Published: Nov 17, 2021
Updated: Sep 16, 2025
Stop reacting to market volatility, start reading it. This playbook will show you how to translate the market's fear into your next strategic move.
Key details:
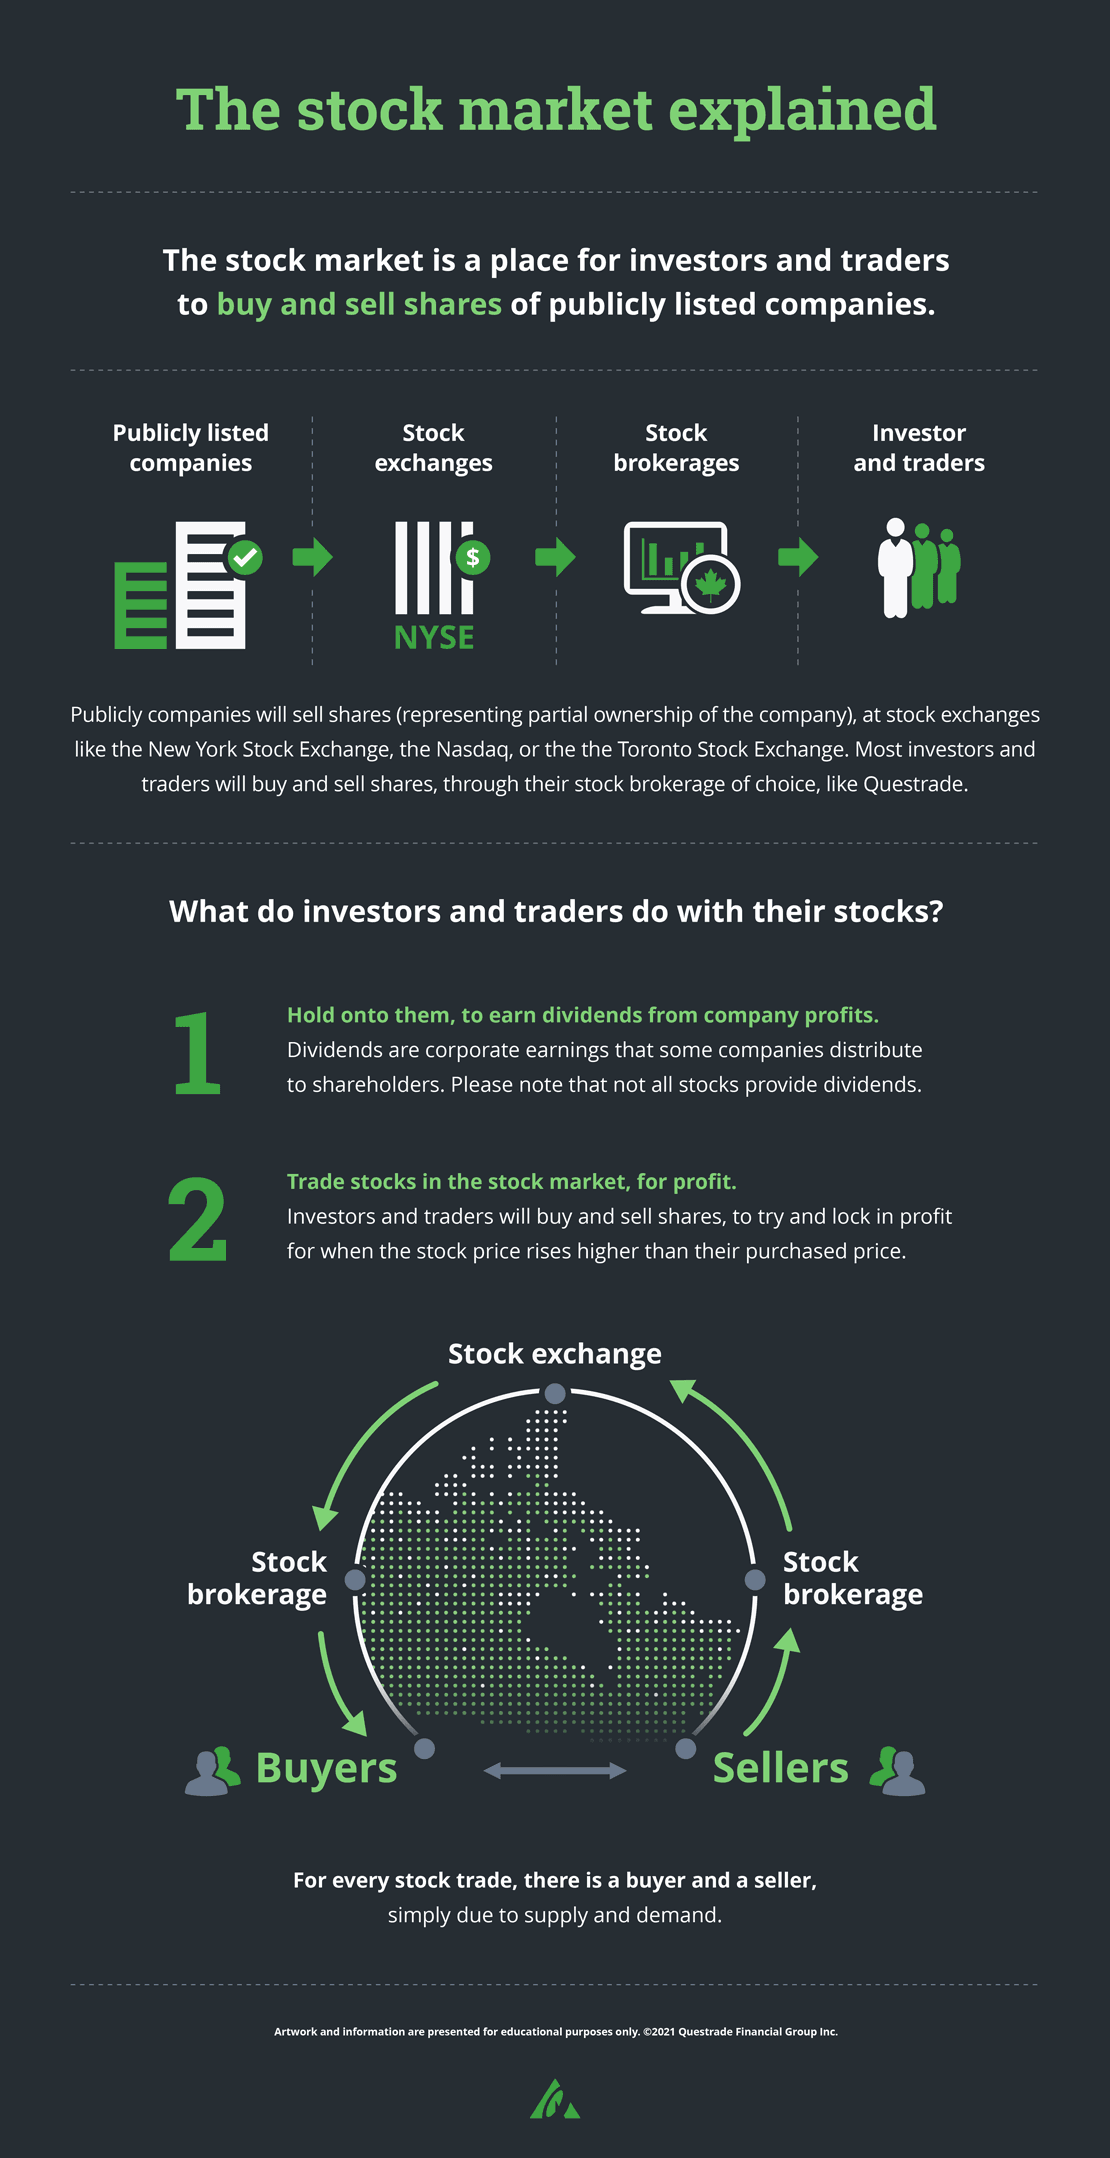
What is the VIX?
The VIX, or Volatility Index, is a real-time index that measures the market's expectation of 30-day volatility. It's often called the "fear gauge" because it tends to rise when stock market volatility increases and fall when the market is calm.
How does the VIX work?
It's calculated using the prices of S&P 500 index options. A higher VIX value suggests investors anticipate larger price swings over the next month, while a lower value suggests a period of relative stability.
Why should the VIX matter to you:
The VIX provides a numbered snapshot of market sentiment. Understanding it can help you contextualize market movements, identify potential opportunities, and make more informed decisions through your self-directed investing.
The big picture:
Volatility isn't just risk. For the prepared investor, it can signal opportunity. This playbook will show you how to read the VIX and use it as a tool in your investment strategy.
That feeling in your gut when the market drops? The VIX gives it a number.
You've felt it before—maybe you're even feeling it now, and that's why you're here. The green line goes red. The pit swells in your stomach as your portfolio's value dips.
It's a cocktail of anxiety and uncertainty and a dozen questions fighting for real estate in your mind, all boiling down to: Is this a blip, or is it the start of something bigger?
That collective feeling—the tension that grips the entire market in big moments—isn't just an emotion. It can be measured. The CBOE Volatility Index, better known as the VIX, gives it a number. And once you can measure it, you no longer have to fear it. You can prepare for it.
So, what is the VIX, exactly? The 60-second answer.
In simple terms, the VIX is Wall Street's "fear gauge."
It's an index that shows the market's expectation of how much the S&P 500 (a key benchmark for the U.S. stock market) will fluctuate over the coming 30 days.
A high VIX means investors expect big price swings—in either direction. This usually happens when uncertainty is high.
A low VIX means investors expect things to be relatively calm.
It's not measuring what the market is doing, but what it thinks it's going to do. And that volatility meaning is crucial: it's a measure of expected movement, not a prediction of direction.
What a Spiking VIX Looks Like in Real Life
Think back to March 2020. For weeks, the VIX had been sleepy, hovering below 20. Then, as the global news of the COVID-19 pandemic broke, it woke up—and then had a panic attack. It climbed past 30, then 50, then exploded to over 80 in a matter of days (opens in a new tab).
That spike was the mathematical signature of global panic. But for some investors, that screamingly high VIX was also a signal—a flashing green light that the market was overcome by fear, creating potential long-term entry points into solid companies at a deep discount.
How to Read the Market's Mood: Interpreting the VIX Number
Think of the VIX as a thermometer for market sentiment. While there are no absolute "good" or "bad" numbers, you can generally break down the readings into three zones:
Zone 1: clear skies (VIX Below 20). When the VIX is in this range, it generally signals low fear and stable market conditions. Investors are confident, and price swings are expected to be minimal.
Zone 2: dark clouds (VIX 20 to 30). This is the zone of heightened awareness. Fear is creeping in. A VIX in this range suggests that uncertainty is growing and investors are starting to brace for larger price movements.
Zone 3: storm warning (VIX Above 30). A VIX above 30 indicates significant fear and uncertainty. Investors expect high volatility, and the market (or the world more broadly) is likely experiencing a major event. It's in this zone that some of the most effective strategies for a bear market are born.
The VIX Playbook: 3 strategic plays for a volatile market
Being able to answer "how does the VIX work" in the abstract is one thing. Using it is another (and really, is more important). Here are three plays to incorporate the VIX into your thinking.
Play #1: Read the extremes.
The VIX often has an inverse relationship with the stock market. When the market falls, fear (and the VIX) tends to rise. Some investors use extremely high VIX levels (e.g., above 40) as a contrarian signal to start looking for buying opportunities, on the theory that peak fear often coincides with market bottoms. Conversely, a very low VIX can signal complacency, a potential warning sign that investors are underestimating risk.
Play #2: Hedge your portfolio.
For more advanced investors, VIX-related products can be used for hedging. For example, buying VIX-linked call options or investing in VIX-related ETFs can potentially offset losses in your main portfolio during a market downturn. These are complex strategies involving sophisticated financial products like options trading and are not suitable for all investors.
Play #3: Find opportunities in Canada.
While the VIX is based on the U.S. market, its sentiment reading is global. Market volatility in Canada often moves in lockstep with the U.S. Ask yourself: which Canadian industries are built to weather a storm, and which are more sensitive to economic headwinds? A major telecommunications company might react differently than a new tech company.
A high VIX is your cue to revisit your watchlist and identify quality businesses being disproportionately affected by the market's panic.
The Big Risk: Why the VIX isn't a crystal ball
The VIX is a powerful tool, but it's crucial to understand what it isn't. It doesn't predict the direction of the market, and it can stay elevated or depressed for long periods.
Think of it this way: the VIX is the map, not the territory. It gives you a sense of the terrain ahead—whether it's likely to be rocky or smooth—but it doesn't tell you exactly which path to take. It should always be used in combination with your own research, financial goals, and risk tolerance.