Your real-time balances can be found on the Positions tab at the bottom of your screen when you launch Edge Mobile.
Lesson Questrade Edge Mobile
Balances and positions
Learn all about how your real-time streaming balances and positions are displayed in Questrade Edge Mobile.
These pages contain useful information about your investments (known as positions) and your cash balances (shown in both CAD and USD).
If you have more than one Questrade account, you can also see your balances combined, or broken down in detail per account.
Check out the short video overview below, or continue reading for more in-depth information.
Note: Securities shown are for illustrative, educational, and visual purposes only, and should not be relied upon as financial advice. The information provided is not intended to be and should not be construed as a recommendation, offer, or solicitation to buy or sell.
Navigating the positions page
- Swipe left or right on the positions page to navigate between accounts, or tap the menu at the top of the page to easily switch to a specific account.
- Choose which currency your balances are shown in, toggle between Combined in CAD or Combined in USD.
- Tap the See all balances button on the top right to view more detailed information about your balances.
- At the top right, you’ll see your Total equity (cash + investments) balance.
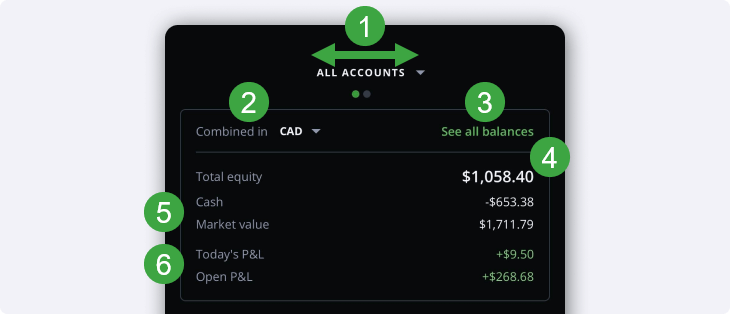
5. Right below, you can also see your available combined Cash balances, and the combined Market value of your investments (in the currency you’ve selected above).
6. At the bottom, you’ll see Today’s P&L (since market open), and your Open P&L amounts.
- Open P&L represents your “unrealized” gains or losses for investments that have not been sold or covered.
When you scroll down past your balances on the Positions page, you’ll see a simplified view of your positions with key information shown.
You can toggle between a simplified and detailed view using the grid menu at the top anytime. We’ll cover this in more detail below.
- At the top left, you’ll see the Ticker symbol of your position, along with the number of shares you currently own (or owe if shorting).
- You’ll also see the average price you bought (or shorted) the position at.
- Tap the more information button on the right to bring up a more detailed view of that individual position.
- Below, you’ll see the Market Value of the position (number of shares * current price), along with your Open P&L and Today’s P&L since market open shown in both absolute dollars and percentages.
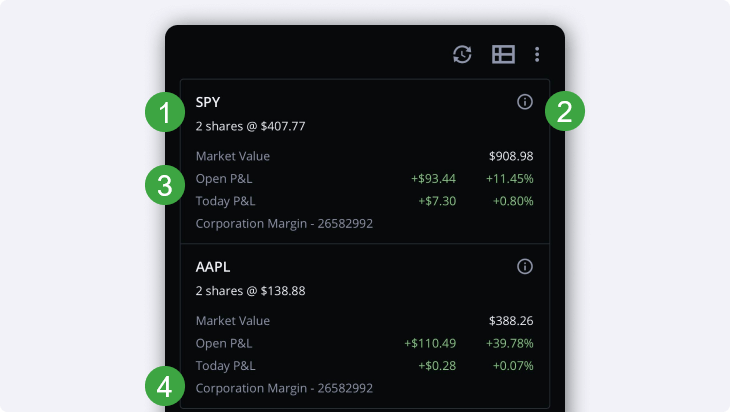
4. If you’re viewing the positions for more than one account in the combined all accounts view, you’ll also see which account this position is held in.
When you tap on any of the positions in your list, this will automatically open the compact quote information drawer at the bottom of your screen. More information on this below.
Tip: If you prefer to only view full quotes, you can also disable the compact quote anytime in your Settings.
The function buttons above your positions also unlock more customization options:

- The button on the left on the shows you information about the streaming quotes in your positions. If your positions contains securities that you don’t have a market data package subscription for, this icon will also be shown beside the security. Those delayed quotes will only refresh when you reload this page.
- The middle button with the grid toggles between a simplified view of your positions, or a more detailed view with additional, customizable columns of information.
- The 3 dots button on the right brings up a menu with options to Sort your view, or group underlying symbols (for options).
- If you have the more detailed view turned on, this menu also allows you to add or remove additional columns of information.
Compact Quote
When you select any of the positions in your list, this will automatically open the compact quote information drawer at the bottom of your screen.
- Tap the magnifying glass or search bar to look for other tickers.
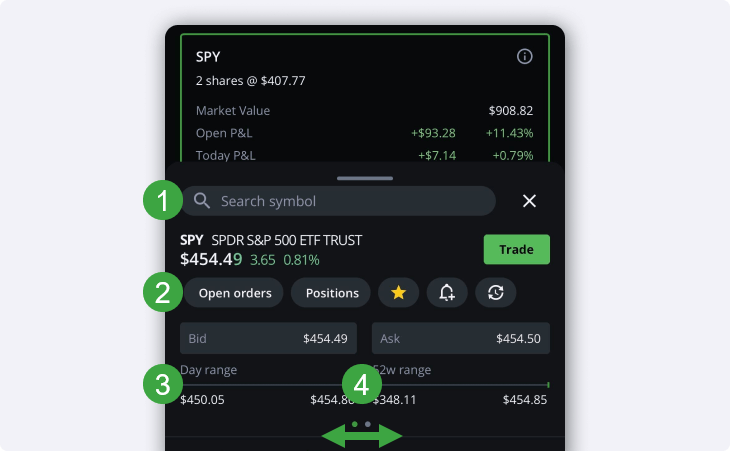
2. The shortcuts buttons allow you to quickly access popular features.
- If you have any Open orders for this security, you can quickly view them from here.
- You can also tap Positions to view more detailed information about this holding.
- Tap the Star icon to add/remove this security from your watchlists.
- Tap the Bell icon to create a new Smart Alert.
- Tap the Streaming icon to view information about the streaming status of this quote.
3. Below this, you’ll see a condensed level 1 quote showing important information at a glance.
4. Swipe left to view a mini chart for the security you’ve selected, or swipe right to come back to the level 1 quote.
After you’ve swiped over, you’ll see a mini chart below the quote. You can also tap the green Trade button at the top right from either screen in the compact quote to quickly make a trade.
- Hold and drag your finger across the chart to view the price action at a specific time or date.
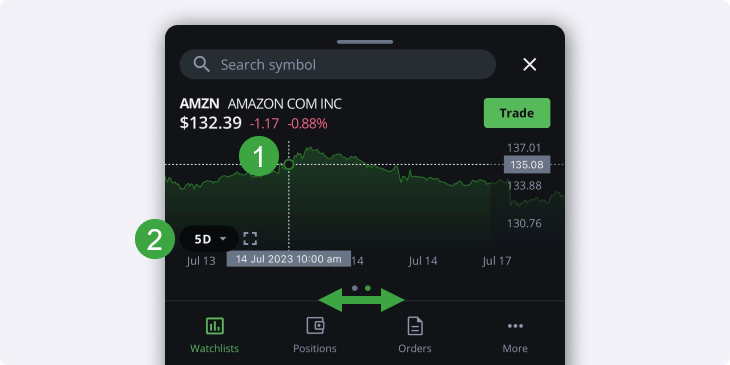
2. Toggle between different time durations shown, or open the full screen chart with the icon on the right.
- Full screen charting enables rich candlestick (or other custom) charts, along with additional technical research tools.
Swipe left to switch back to viewing the condensed level 1 quote including the current Bid & Ask.
Detailed positions view
- Tap on any of the column headers like Symbol or Avg Price to organize your positions ascending or descending according to that specific column.
- When you tap the grid button above your positions, or enter full screen, you’ll see a rich, detailed view of your positions in columns and rows.
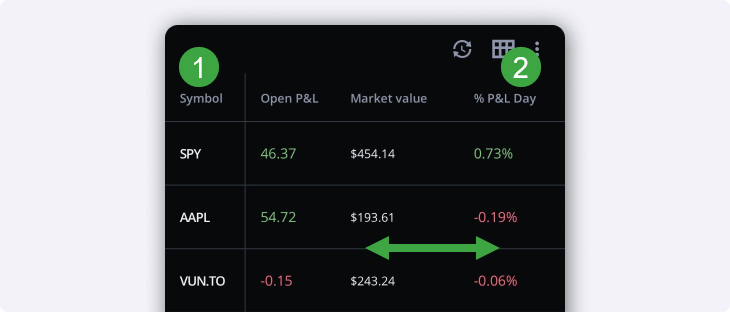
You can also swipe left or right to view additional columns of information in the more detailed positions view.
To customize what information is shown on this page, tap the menu button with 3 dots to add or remove columns.
By default, the following data points are shown:
- Open QTY: The amount of shares you currently own (or owe if shorting).
- Closed QTY: The amount of shares you’ve sold (or bought to cover if shorting).
- Avg Price: The average price you’ve paid per share.
- Price: The current price per share of the security.
- Market value: The market value of your position (# of shares multiplied by the current price).
- % Portfolio: The percentage of your overall portfolio that this position represents.
- Open P&L: The unrealized profits or losses (unrealized P&L will change as the price per share changes).
- Closed P&L: The realized profits or losses after selling a security (or buying to cover if shorting).
If you’re interested in viewing more information such as dividends, P/E, EPS and much more, you can enable additional data columns using the menu button with 3 dots.
Edit columns
On the Edit columns window, you’re able to add additional data points to your positions page, and re-order your columns however you’d like.
- Hide columns you don’t need.
- Drag and drop displayed columns to whatever order you’d like.
- Add columns of additional information to your positions page.
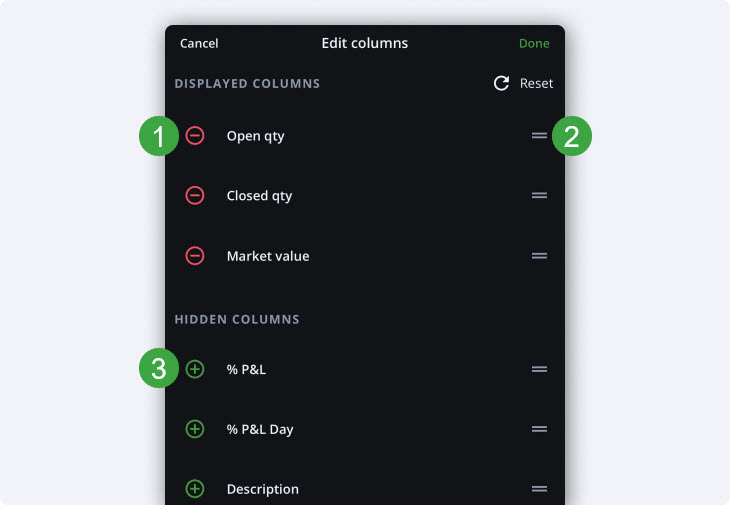
The additional columns of information available are:
- % P&L (total)
- % P&L Day
- Description (security name)
- Sec(urity) type
- Currency
- P&L Day $
- Entry price
- Exchange
- Book value
Add as many columns of information as you’d like!
If you add a large amount of columns, you may need to scroll for a little while to see the data you’re looking for. Full-screen landscape mode makes this much easier.
Detailed balances view
The detailed balances page contains a wealth of useful information about all the different balances for your account(s). To get to your detailed balances, simply tap See all balances from the main positions page.
- At the top of the page, you can switch between viewing individual accounts, or your combined balances across all accounts.
- You can also swipe left or right to quickly switch account views.
- Choose which currency your balances are shown in, toggle between Combined in CAD or Combined in USD.
- Below, you’ll see your Total equity (cash + investments), Today’s P&L (since market open), and your Open P&L (unrealized gains/losses).
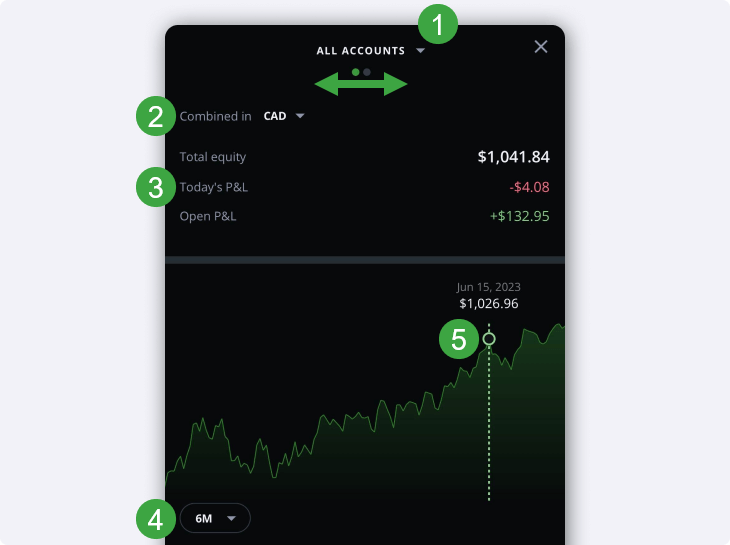
4. Tap the time range to switch between 1 month, 3 months, 6 months, 1 year, or since account opening.
- Your returns for the selected time range will be shown at the bottom right corner of the chart.
5. Hold and drag anywhere on the chart to view the balances for that specific day or time period, the total equity will be shown above the pointer.
The different balances for your account will be visible below.
Let’s take a deeper look at the different balances in your account and what they mean.
Understanding your balances
One of the keys to account and portfolio management is understanding your account balances.
Because Questrade allows you to invest in CAD and USD simultaneously, this can be a little confusing the first time you’re looking at some of these figures.
Before we jump into some explanations, it’s important to understand the differences between trading with a registered account (TFSA, RRSP, etc.) and a non-registered Margin account.
Because Margin accounts allow you to borrow funds (leverage) to invest or trade, they do not automatically convert currencies for you.
If you place a trade in USD, and only have CAD cash available for example, you will be borrowing USD after the trade executes until you either convert your CAD cash, sell your shares to obtain USD cash, or deposit additional USD cash.
Registered accounts (TFSA, RRSP, RESP, etc.) will automatically convert your currencies after your trades at the end of the trading day to avoid negative balances due to CRA rules.
Read more about currency conversion in registered and non-registered accounts.
Below the chart on this page, you’ll see your account’s CAD, USD, Combined in CAD, and Combined in USD balances.
- Swap between your Current (live) balances, or your Start of day balances.
- Display your currencies Separately, or Combined.
- Remember: Interest charges are based on separate individual currencies if borrowing funds to invest.
- In the screenshot below, since the USD cash is negative, daily interest would apply.
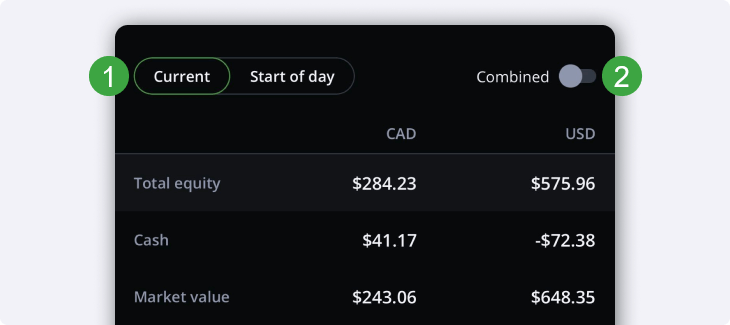
- Total equity is your cash plus investments.
- Cash is your uninvested/liquid cash that is available to use.
- Market value is the value of all your investments combined.
This area shows your CAD and USD balances separately, and also in combined amounts.
Combined in CAD shows your actual CAD cash + investments along with an approximate converted amount for your USD cash + investments.
The FX rate used for the USD/CAD conversion is based on the rates at the close of the previous business day.
Combined in USD shows your actual USD cash + investments, along with an approximate converted amount for your CAD cash + investments.
Note: The Combined in CAD and USD amounts have a small currency conversion buffer applied to the foreign exchange rate. This is for display purposes only, and is used to prevent registered accounts from entering negative balances unexpectedly.
Buying power
Right below your total equity, cash and market value, you’ll see an area that is especially important for Margin accounts. This is because with a Margin account, you’re able to borrow (leverage) funds to invest with more cash than you have available.
Generally, the most you can leverage your equity is 70% due to the 30% Margin requirement on securities you hold on your account.
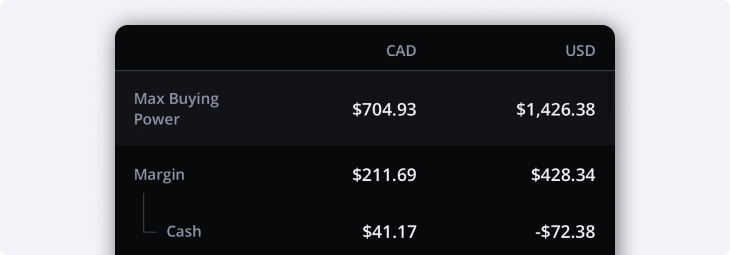
- Max Buying Power shows the hypothetical maximum amount you could borrow to trade with.
- Margin shows your Buying power and represents the amount of available equity in your account that you can borrow against.
- Tip: This value shows how ‘close’ you are to a margin call.
- Cash is your uninvested/liquid cash that is available to use.
Total invested capital
This area on your detailed balances page shows your invested capital (money) over time.
You can also tap the green Add funds button to launch a shortcut to make a deposit to your account(s).
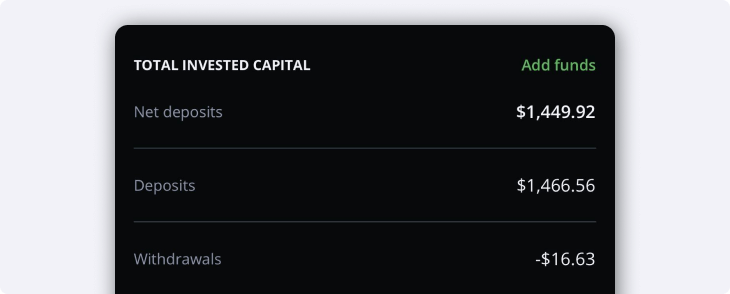
- Net deposit shows your total cash deposits (minus withdrawals) since you’ve opened your account.
- Deposits show your total gross deposits.
- Withdrawals show how much cash you’ve withdrawn to your bank account.
Learn more about the different ways to deposit CAD or USD to your account(s).
Detailed profit & loss (P&L)
At the bottom of your detailed balance page, you’ll see your account’s profit and loss figures.
- Day P&L shows your total daily gains or losses in CAD, USD and percentage amounts. This will be calculated since market open at 9:30am ET.
- Open P&L shows your total unrealized gains or losses in CAD and USD.
- Unrealized means you haven’t sold (or covered) your investment yet, and that the price will fluctuate.
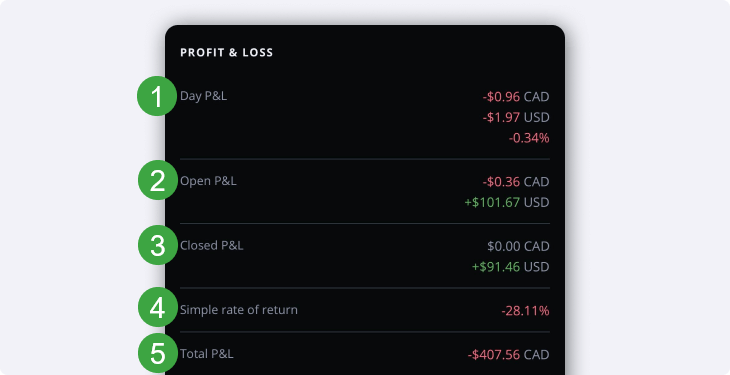
3. Closed P&L shows your total realized gains or losses in CAD and USD.
- Realized means you’ve sold (or bought to cover) your investment, and that the price difference has been “locked in”.
4. Simple rate of return measures your account’s performance by comparing the money you’re earned with the money you’ve deposited and withdrawn.
5. Total Profit & loss shows your overall gain or loss in your account.
Note: The information in this blog is for information purposes only and should not be used or construed as financial, investment, or tax advice by any individual. Information obtained from third parties is believed to be reliable, but no representations or warranty, expressed or implied is made by Questrade, Inc., its affiliates or any other person to its accuracy.
Related lessons
Want to dive deeper?
Funding your account
Explore the many different ways you can deposit funds to your Questrade account(s).
View lessonRead next
Questrade trading platforms
Discover all of Questrade’s trading platforms and decide which one is best suited for you, and your investment style.
View lessonExplore
Explore QuestMobile
Learn all about QuestMobile, the easy-to-use trading app designed for anyone who wants to start investing in the stock market.
View lesson