Note: The information in this blog is for information purposes only and should not be used or construed as financial, investment, or tax advice by any individual. Information obtained from third parties is believed to be reliable, but no representations or warranty, expressed or implied is made by Questrade, Inc., its affiliates or any other person to its accuracy.
Lesson Researching investments
Research - Questrade Edge Desktop
Learn more about the Research tools available in the Questrade Edge Desktop platform
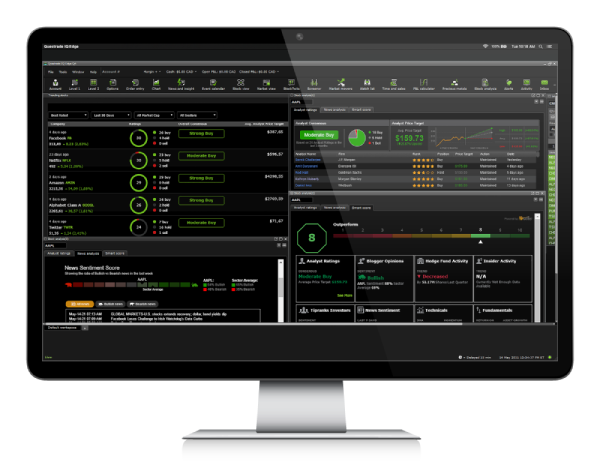
Questrade Edge Desktop offers the same research tools as Edge Web above, the only difference is how you access them. In Questrade Edge Desktop, these tools are available through the Research and Stock Analysis widgets found in the top navigation menu.
Explore the sections below for more in-depth information about the research tools available.
Please note: Research, daily ratings, trending stocks, and Smart Score are provided by TipRanks. The availability of these services and the information that may be conveyed through them do not constitute any form of trading or investment advice by Questrade. Questrade cannot guarantee the timeliness, accuracy, and reliability of these Tipranks services and the information that may be conveyed through their use. Questrade will not be held liable nor assume any liability for any loss or damages arising directly or indirectly from the use of these Tipranks services. Any liability, whether direct, indirect or consequential loss or damage is explicitly disclaimed.
To access the Trending stocks page in Questrade Edge desktop, please:
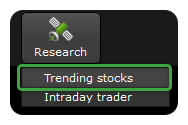
- Open Questrade Edge desktop on your computer, and log in
- Click the Research button from the top navigation menu, then click Trending stocks from the drop-down menu
Tip: If you cannot see the research button on a smaller display, please click the arrow icon at the top right-hand side of the navigation bar.
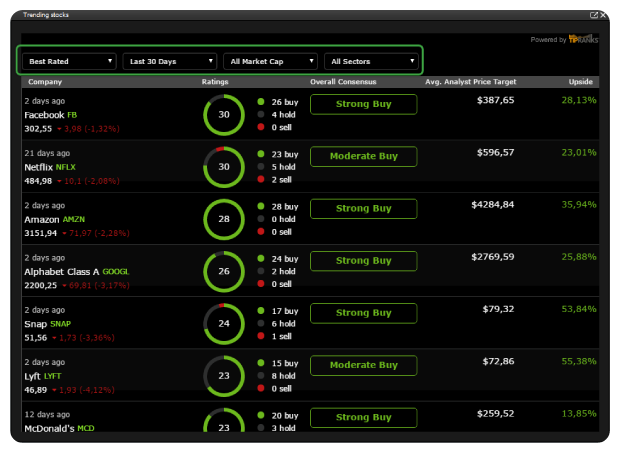
Trending Stocks is a screener, and your go-to area to help you find fresh trading ideas and opportunities. It offers a number of filtering tools allowing you to focus on Buy, Hold or Sell recommendations.
This page can also be filtered using the tools at the top:
- Switch between best, worst and most rated
- Filter between the last 30 days, 7 days, or 72 hours
- View different market caps of companies from micro to mega
- Swap between common market sectors such as consumer goods, services, utilities, and more
Please note: All companies and ticker symbols shown are for example and educational purposes only.
Let’s take a deeper look at a Company’s rating and quote:
- On the left, we can see the company’s name and a recent quote.
- You can also click on the stocks ticker symbol beside the name to go directly to the stocks page.
- You’ll also see the last traded price, dollar and percentage changes since market open.
- In the Ratings column, we’ll see the number of analyst ratings, and the breakdown of buys, holds and sells.
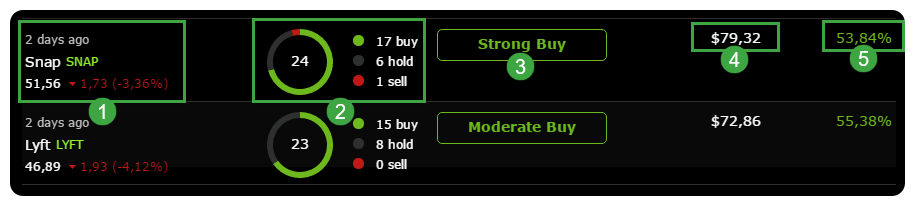
- You can also see the Overall Consensus, this can range from a Strong Buy, to a Strong Sell.
- The Average Analyst Price Target is also shown, this consolidates all the analyst price targets into one neat average.
- Lastly, you’ll see the potential percentage upside, or downside.
- This is the difference between the current price, and the average analyst price target.
To view Analyst ratings for specific companies in Questrade Edge desktop, please:

- Open Questrade Edge desktop on your computer, and log in
- Click the Stock Analysis button from the top navigation menu
- Enter a ticker symbol in the lookup box at the top left
At the top of the tab, you’ll see the overall Analyst consensus on the left, which aggregates all of the analyst ratings from the last 3 months.
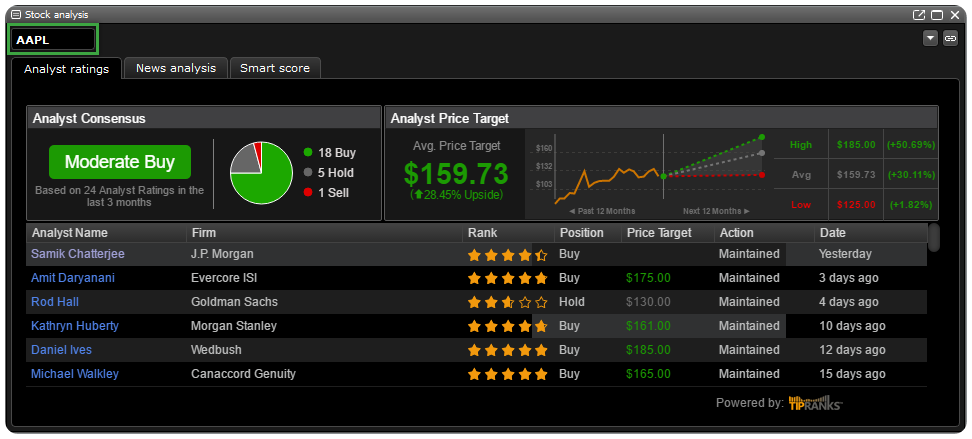
Analysts, ratings and tickers shown are for example educational purposes only and may not reflect current market conditions.
On the right, you’ll see the average Analyst price target shown both as a dollar and percentage value, and in a neat graph.
You can see the individual Analyst Ratings below these graphs.
Let’s take a closer look at the Analyst ratings section below:
- The left column shows the Analyst’s name
- Next, the Analyst’s firm or publication is shown
- You can also see the Analyst’s Star rating
- Learn more about Analysts and their recommendations here
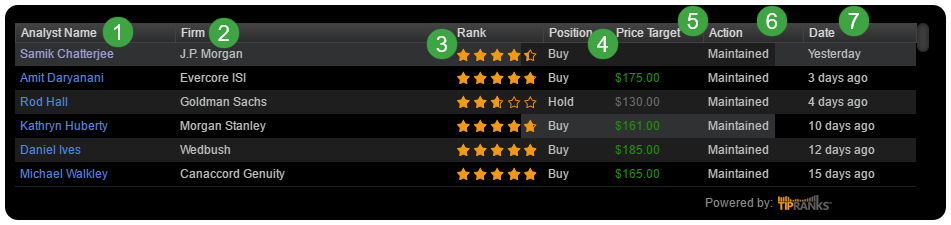
- Here you can see the Analyst’s recommendation or Position, and whether it’s a Buy, Sell, or Hold
- The Price Target shows the approximate price target of the Analyst.
- The Action column shows whether the Analyst has Maintained (or Reiterated) their earlier positions, Upgraded, or Downgraded
- The Date shows what date the Analyst has made their recommendation
You can also hover over an analyst’s name to view more details about their recommendations and performance record:
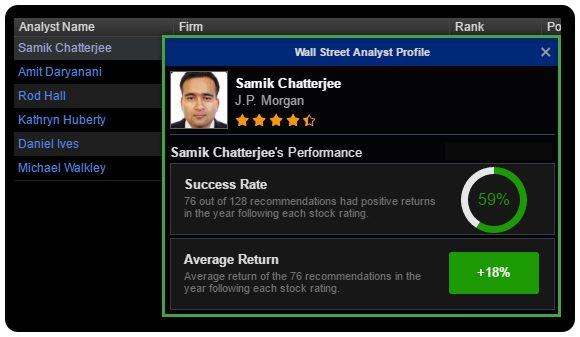
You’ll see the Analyst’s Success Rate, which shows how many of their predictions had positive returns in the year following the rating. This is shown as a percentage of their overall ratings.
In this example, Mr. Chatterjee has made 128 recommendations, of which 76 had positive returns.
You can also see the Average Return, which shows what the average rate of return was for this Analyst’s successful recommendations.
To view News analysis for specific companies in Questrade Edge desktop, please:
- Open Questrade Edge desktop on your computer, and log in
- Click the Stock Analysis button from the top navigation menu
- Click the News analysis tab at the top of the widget, and enter a Ticker symbol in the lookup box at the top left
The News analysis tab aggregates Analyst ratings, News Sentiment, and Media buzz to display a wealth of information to help you make more informed trading decisions.
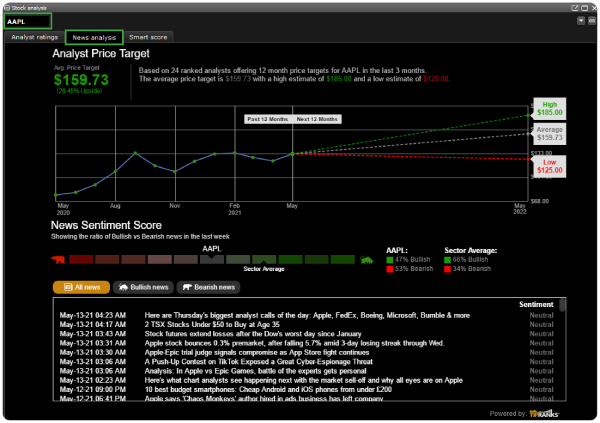
Please note: All companies and ticker symbols shown are for example and educational purposes only.
At the top of the widget, you’ll see a graph showing the Analyst Price Target.
This is the potential upside, or downside based on the newest, highest ranked analyst ratings.
Below the Analyst Price Target and graph, you’ll see the News Sentiment Score.
You’ll also see how your ticker compares to sector averages, and the percentage of each type of article.
Below, you’ll see a list of news articles sorted by most recent, and you can click to open them in a browser window for further reading.
Sort articles by All news, Bullish, or Bearish.
To view a specific companies’ Smart Score in Questrade Edge desktop, please:
- Open Questrade Edge desktop on your computer, and log in
- Click the Stock Analysis button from the top navigation menu
Click the Smart score tab at the top of the widget, and enter a Ticker symbol in the lookup box at the top left.
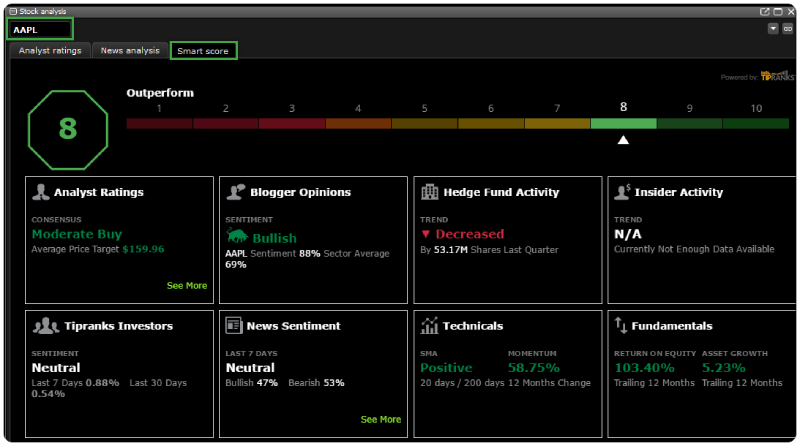
Please note: All ticker symbols and companies shown are for educational and display purposes only.
What is the Smart Score?
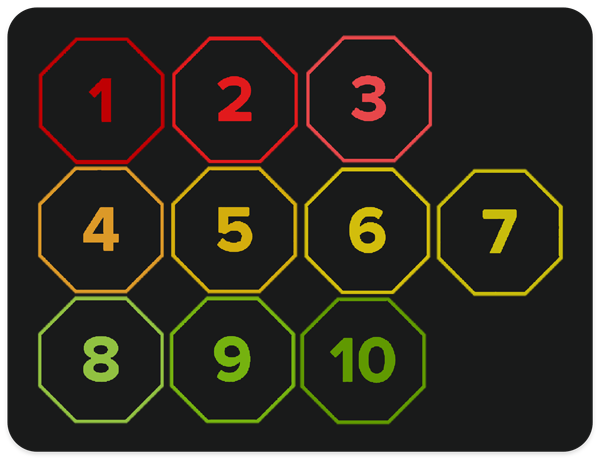
The Smart Score is a proprietary quantitative stock scoring system created by TipRanks. It rates stocks from one to ten, based on 8 key market factors. The lowest score is a 1 and the highest is 10. The scoring system works as follows:
Stocks with a score of 1, 2, or 3 are considered to be Underperforming
Stocks with a score of 4, 5, 6, or 7 are considered to be
Neutral
Stocks with a score of 8, 9, or 10 are considered to be Outperforming
The score is data-driven and does not involve any human intervention. Let’s take a deeper-dive on exactly how TipRanks calculates the Smart Score:
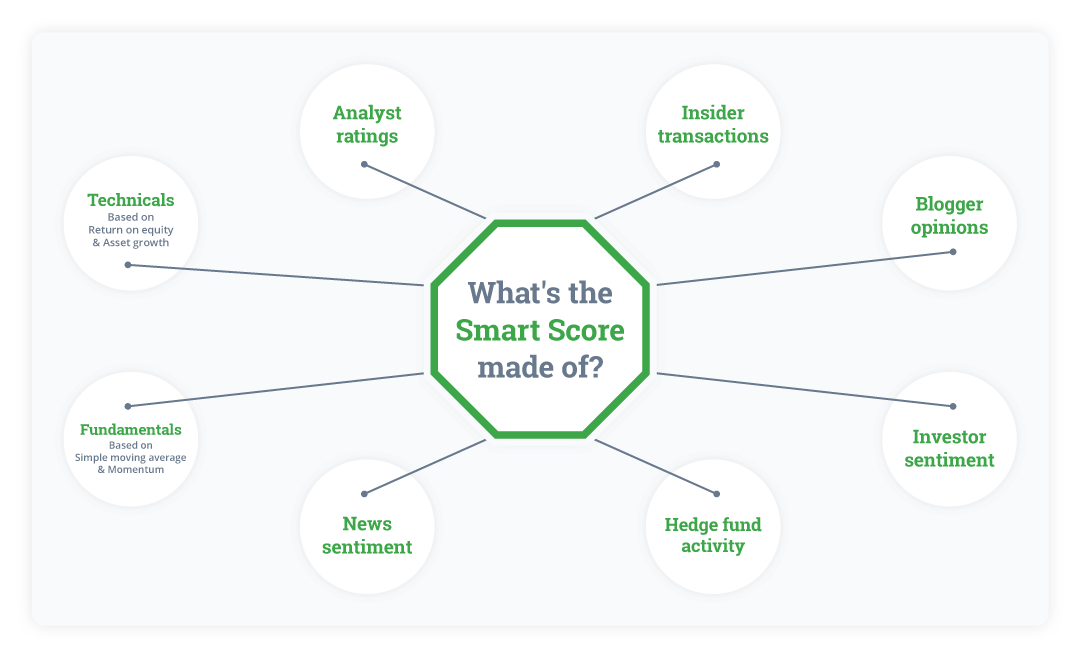
How is the Smart Score calculated?
The 8 market factors that contribute to the rating are: analyst ratings, insider transactions, blogger opinions, investor sentiment, hedge fund activity, news sentiment, technicals, and fundamentals.
These individual components are explained in more detail below.
These eight factors equally contribute to the rating, and each factor makes up 12.5% of the Smart Score.
The Fundamentals, and Technicals are divided into two sub-categories each representing 6.25%
- Technicals: SMA - 6.25% (simple moving average at 20 and 200 days), and Momentum - 6.25% (12 months change)
- Fundamentals: Return on equity - 6.25% (trailing 12 months), and Asset growth - 6.25% (trailing 12 months)
If any of the eight factors are not available, they are considered to be contributing a neutral value to the Smart Score.
The Smart Score ranking is also relational. This means that once the score is calculated based on the 8 factors, the stocks are arranged from highest to lowest.
The top ranking ~4% of stocks receive a Smart Score of 10. The next ~7% get a Smart Score of 9 and so on.
As the number of securities analyzed by TipRanks changes (due to new coverage, listings or IPOs) the Smart Score may also change, even if the 8 market factors remain the same.
Market factors contributing to the Smart Score
These are the eight market factors that contribute to the Smart score:
Financial analyst ratings
Analyst consensus is based on sell side analyst ratings issued within the last 3 months.
Corporate insider transactions
Insider Activity provides you with insight into whether corporate insiders are net buyers or sellers of the company’s stock.
Financial blogger opinions
Blogger sentiment is based on blog posts analyzed by TipRanks’ natural language processing technology.
Please note: Bloggers publish their own personal opinions and may not have any formal education or qualifications.
Bloggers consensus is based on tracking and measuring the performance of over 50,000 individuals. Data is based on Tipranks’ three tier proprietary formula, which ranks them based on the following:
- Success Rate - This measures the win-to-loss ratio
- For example: The number of accurate vs inaccurate picks. 10 losing transactions cannot be offset by one winning transaction with a high profit
- Average Return - a bloggers overall performance
- Statistical Significance - a measure of the blogger's consistency based on the number of submissions received
- For example: A blogger with a 1000% average return but with 1 submission would rank very low. A blogger with a 2% average return with many submissions would rank very high.
Individual investor sentiment
Sentiment is based on the percentage of portfolio increase or decrease in the last 7 and 30 days by hundreds of thousands of individual portfolios of TipRanks subscribers.
Hedge fund manager activity
Hedge Fund Activity is an indicator of the net Hedge Fund purchases or sales in the previous quarter.
News sentiment
Sentiment is based on the last seven days of news stories analyzed by TipRanks’ natural language processing technology, and can show you the trends in current news sentiment for this specific ticker.
Fundamentals
The fundamentals measurement is split into 2 categories: Return on Equity, and Asset growth. Both of these are measured for the last 12 months trailing when corporate earnings information is publicly available.
Technicals
The technicals measurement is also split into 2 categories: SMA (Simple moving average) over 20 and 200 days, and the Momentum (12 months change).
Six of the eight market factors incorporated into the Smart score are unique to TipRanks, only the technicals and fundamentals are not.
Please note: Research, daily ratings, trending stocks, and Smart Score are provided by TipRanks. The availability of these services and the information that may be conveyed through them do not constitute any form of trading or investment advice by Questrade. Questrade cannot guarantee the timeliness, accuracy, and reliability of these Tipranks services and the information that may be conveyed through their use. Questrade will not be held liable nor assume any liability for any loss or damages arising directly or indirectly from the use of these Tipranks services. Any liability, whether direct, indirect or consequential loss or damage is explicitly disclaimed.
Related lessons
Want to dive deeper?
Options trading
Get a comprehensive guide to Options trading using the different Questrade Edge platforms.
View lessonRead next
Questrade trading platforms
Discover all of Questrade’s trading platforms and decide which one is best suited for you, and your investment style.
View lessonExplore
Introduction to options trading
Get a comprehensive introduction to trading options, how they work and answers to common questions and terminology.
View lesson