Note: The information in this blog is for information purposes only and should not be used or construed as financial, investment, or tax advice by any individual. Information obtained from third parties is believed to be reliable, but no representations or warranty, expressed or implied is made by Questrade, Inc., its affiliates or any other person to its accuracy.
Lesson Introduction to charting
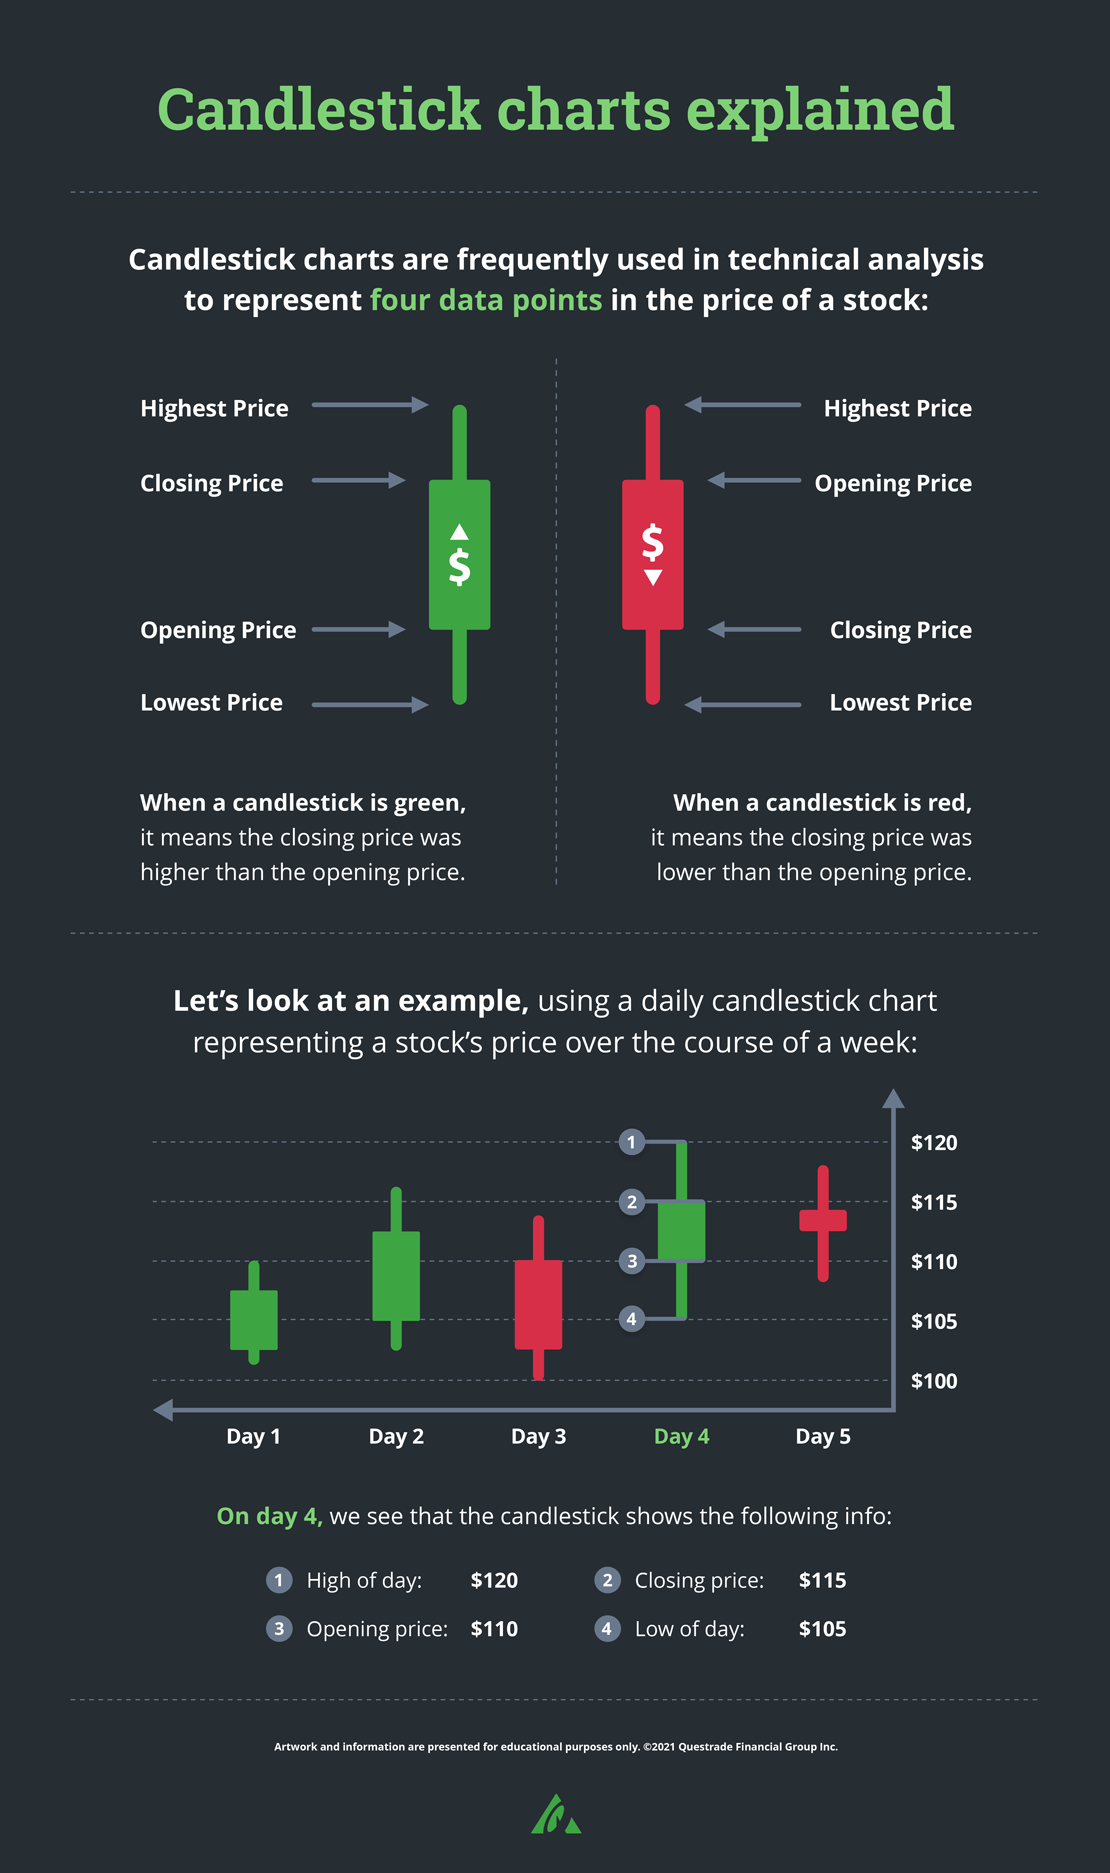
Candlestick charts explained (Infographic)
Learn about candlesticks and how to read them in this infographic.
Related lessons
Want to dive deeper?
Researching investments
Learn about how to make the most of the research tools available to you in each Questrade platform.
View lessonRead next
Investment tools at Questrade
Learn more about the tools available through our API Partners to unlock new research, trading, and portfolio optimization capabilities.
View lessonExplore
Navigating market volatility
Take a look at the different ways in which you can invest during a volatile market.
View lesson